View CelerData clusters
CelerData displays all of the clusters created within your CelerData cloud account on its console. You can get an overview of all clusters or dive down into the details of each individual cluster.
Get an overview of all clusters
Sign in to the CelerData Cloud BYOC console.
The Clusters page appears, presenting an overview of all clusters created within your CelerData cloud account. The overview includes the cloud provider region, creation time, and status of each cluster.
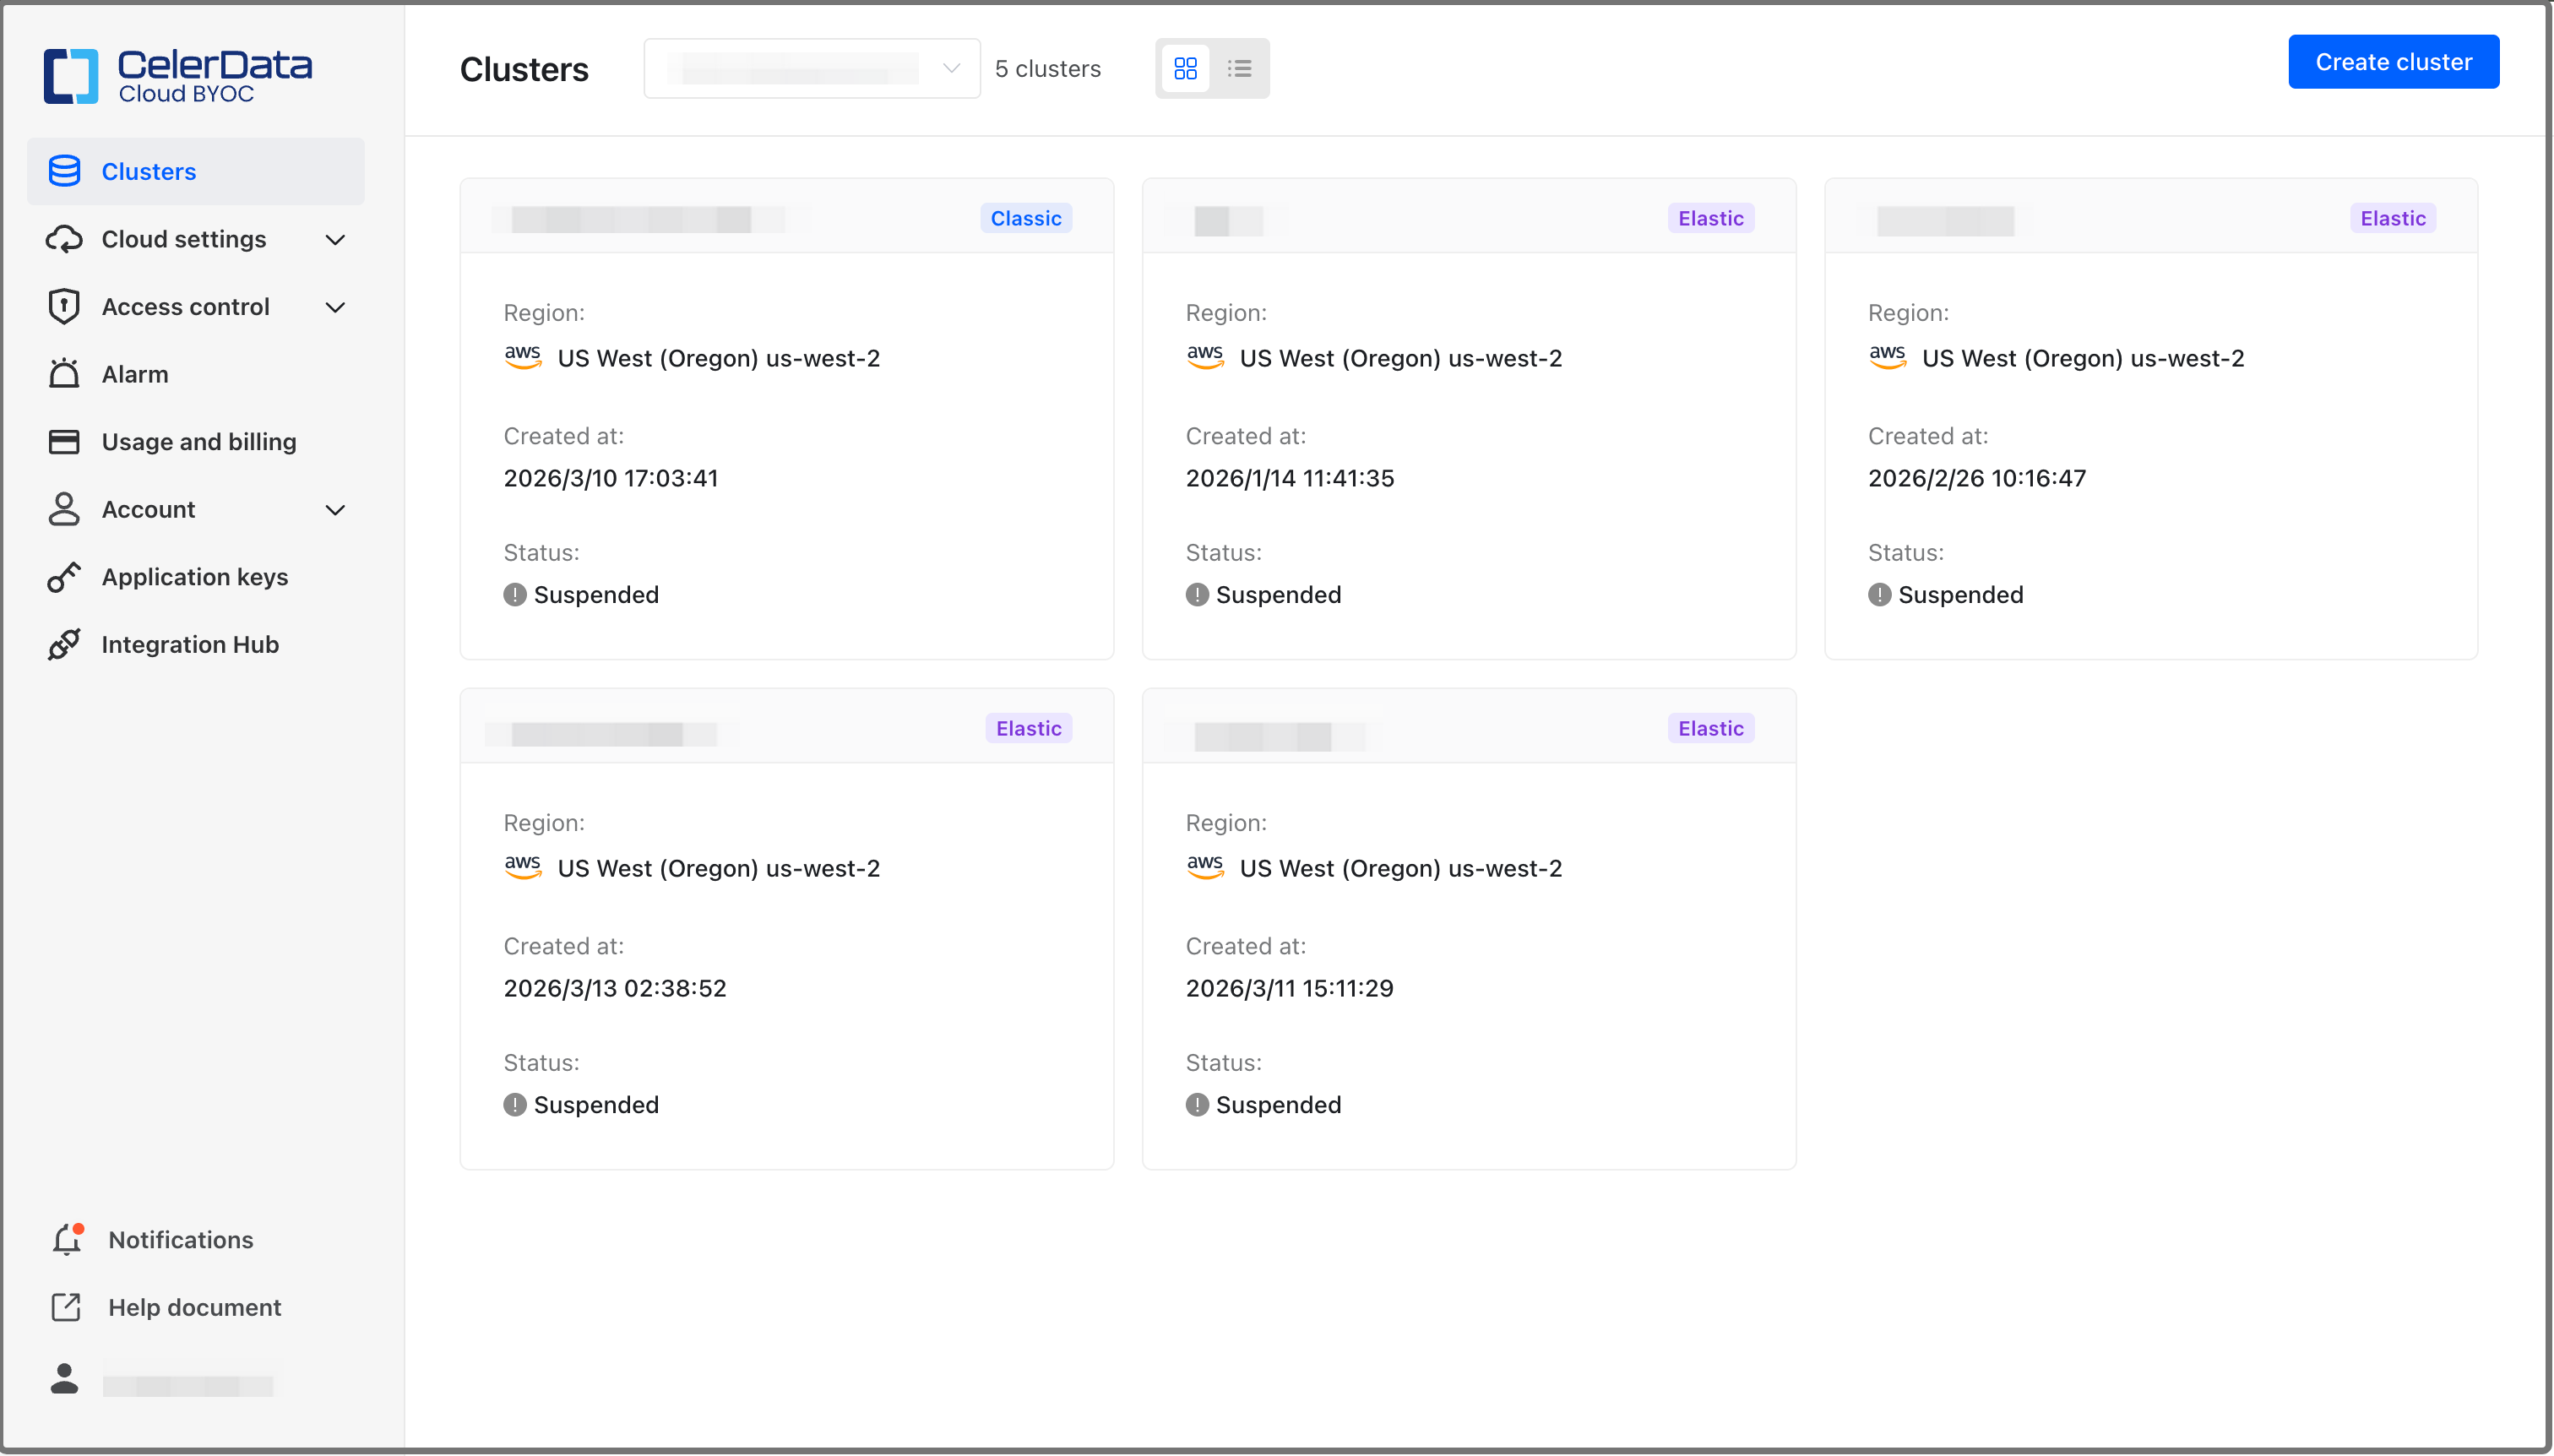
You can switch to another account and view the cluster within by selecting the account in the drop-down list at the top (if you have the View Cluster privilege in that account). However, you cannot perform any operations on the clusters in a different account from the one you signed in to.
View the details of a cluster
Sign in to the CelerData Cloud BYOC console, and on the Clusters page click the cluster that you want to view. Then the cluster details page that consists of the following tabs appears:
- Overview
- Warehouses
- Cloud Settings
- Resource Scheduling
- Deployments
- Cluster parameters
- Security
- Backup and Restore
Overview
The Overview tab provides the general information of the cluster, including cluster properties, billing, usage, and activities.
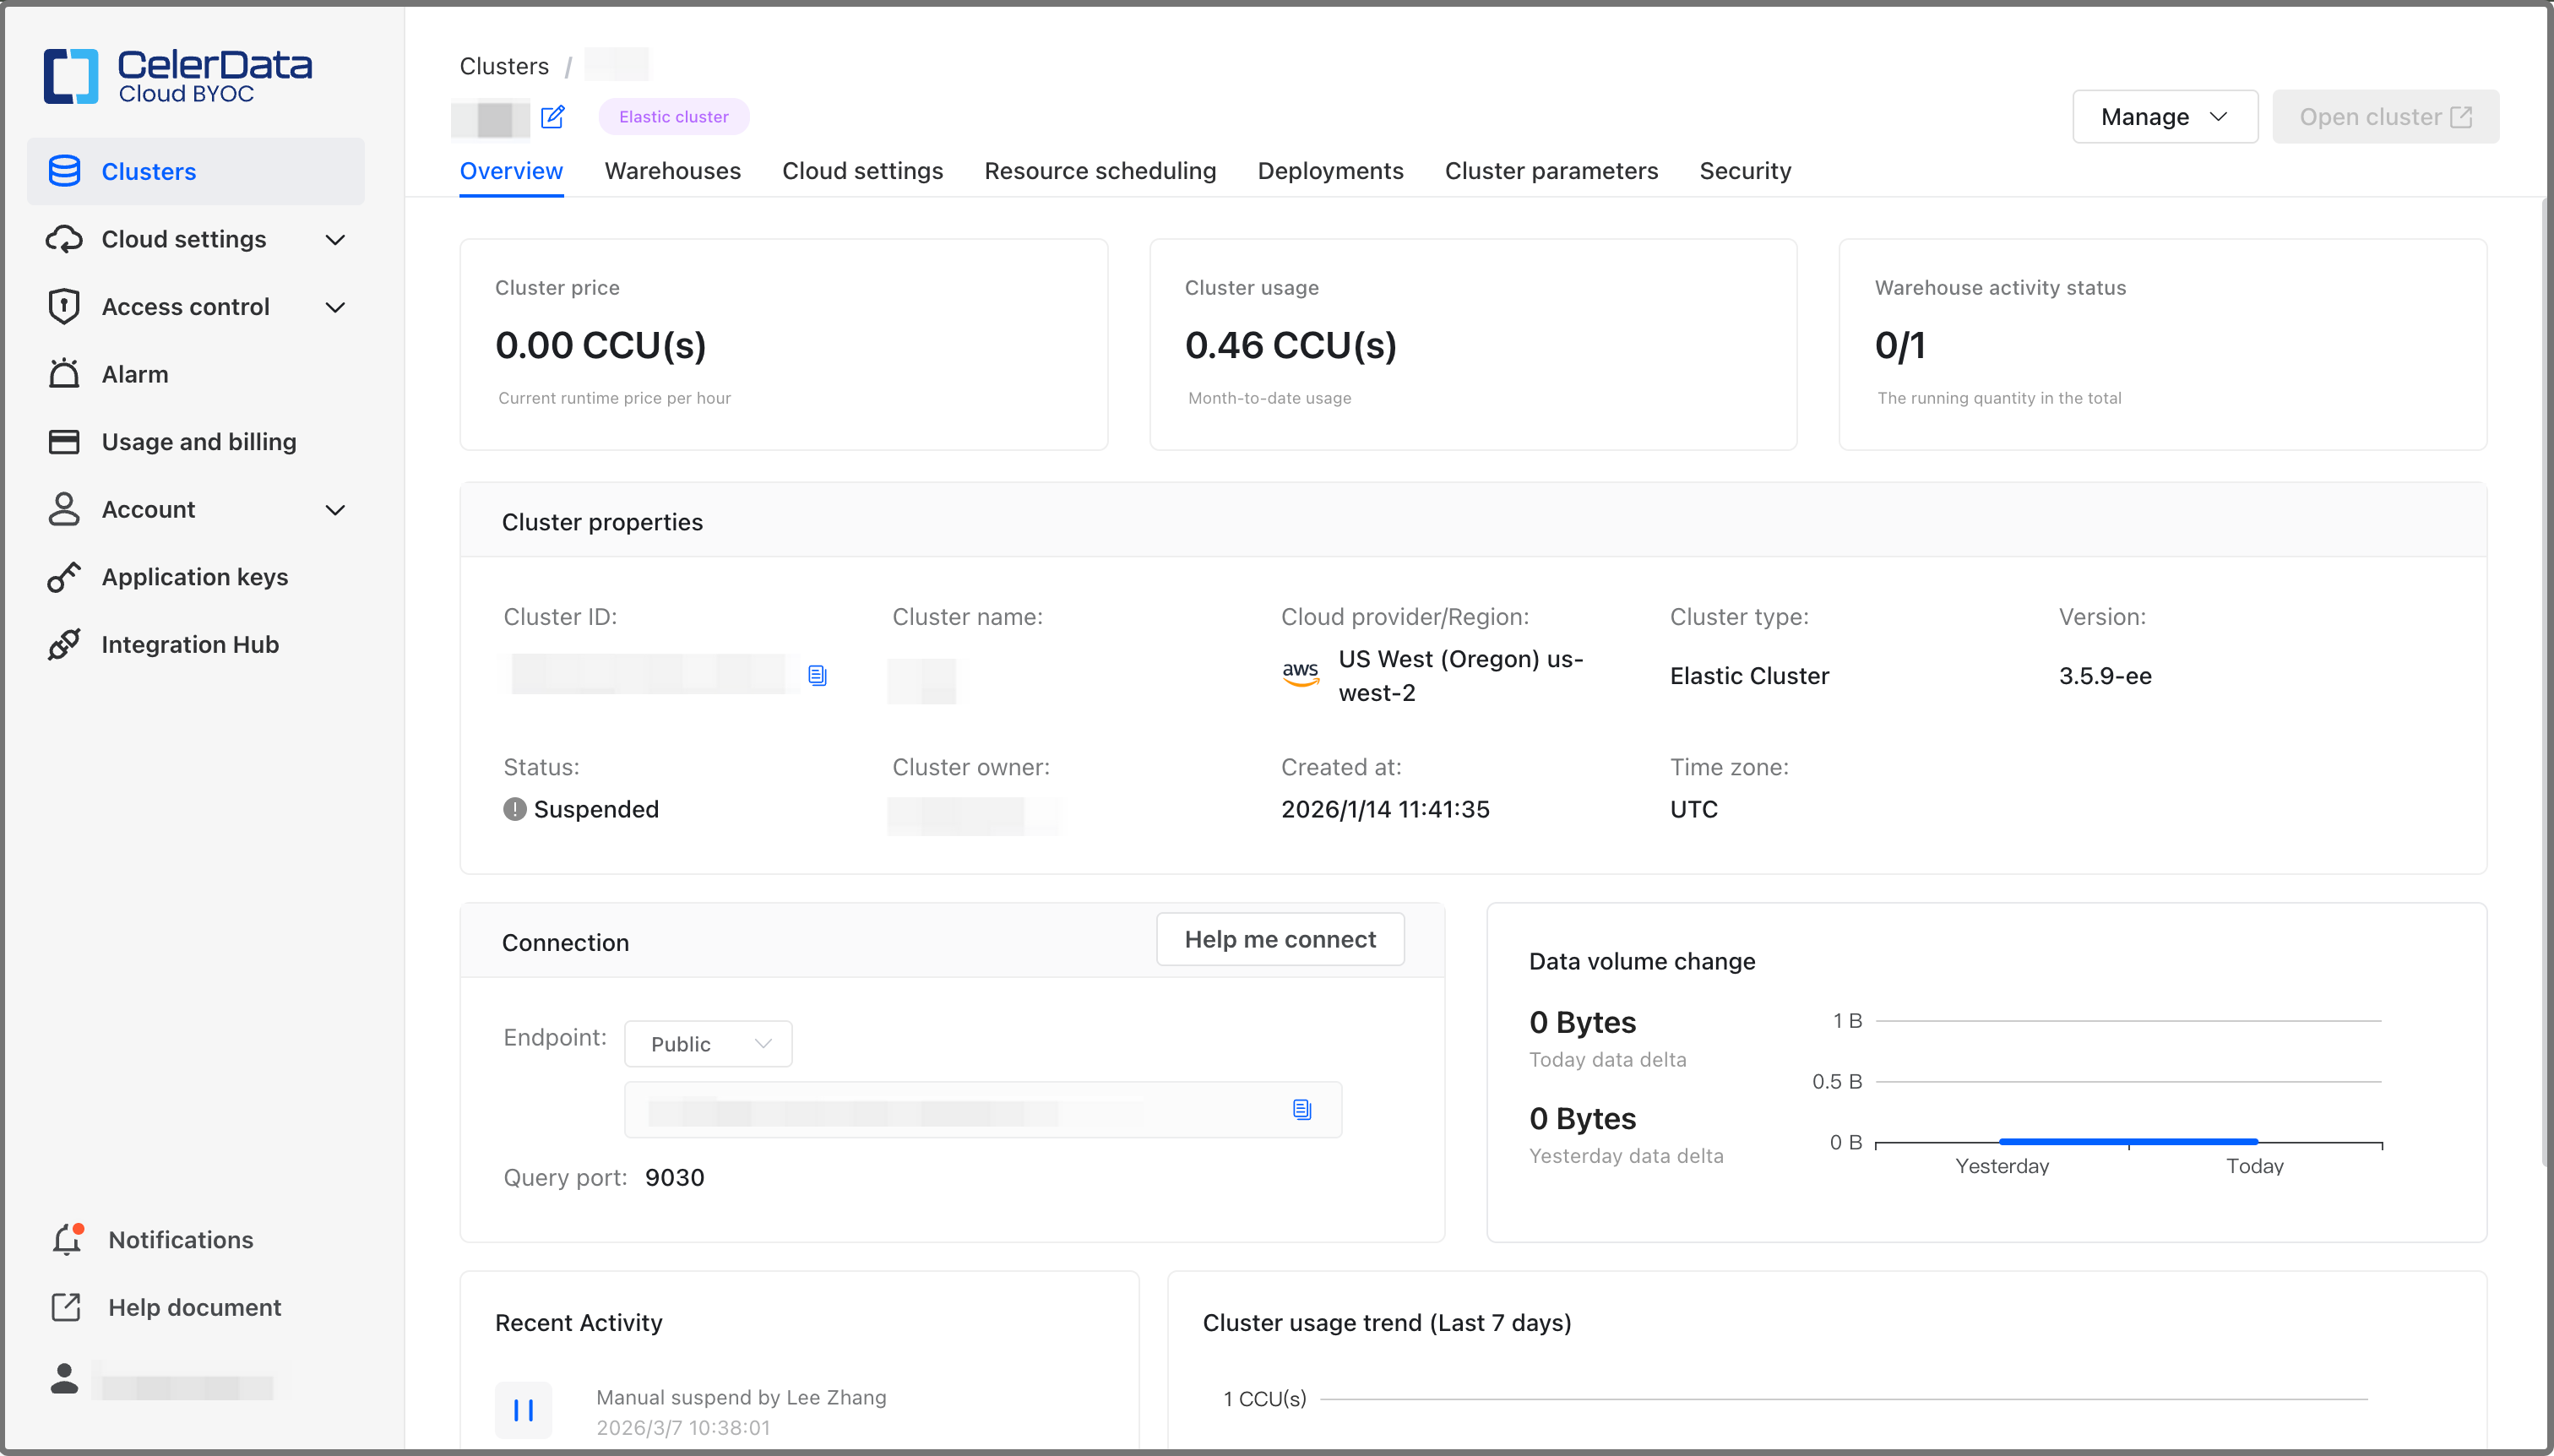
The Cluster properties section displays the basic information of the cluster, including the following properties.
| Property | Description |
|---|---|
| Cluster ID | The ID of the cluster. |
| Cluster name | The name of the cluster. |
| Cloud provider/Region | The cloud provider and region that hosts the cluster. |
| Cluster type | The cluster type. |
| Version | The version of CelerData that is run by the cluster. |
| Status | The status of the cluster. Valid values:
|
| Cluster Owner | The name of the CelerData cloud user who created the cluster. |
| Created at | The time at which the cluster was created. |
| Timezone | The default timezone of the cluster. |
The Connection section displays the information that you can use to connect to the cluster, including the following properties.
| Property | Description |
|---|---|
| Endpoint | The endpoint that is used to connect to the cluster. |
| Query port | The port that is used to connect to the cluster. The port is the query_port of the cluster. |
In addition to the preceding three sections, the Overview tab also displays the following information:
- The number of CCUs per hour
- The month-to-date usage
- Warehouse activity status
- The size of delta data for today and the size of delta data for yesterday
- Recent activities
- Cluster usage trend in the last 7 days
Rename a cluster
The Edit Cluster privilege is required.
By clicking the Edit button next to the cluster name at the top, you can specify a new name for the cluster, and click Confirm to confirm the change.
Warehouses
On this tab, you can:
-
Create new warehouses.
-
View and manage existing warehouses.
Create new warehouses
Follow these steps to create a warehouse:
-
Click Create warehouse.
-
In the dialog box that appears, enter a name and optionally a description for the warehouse, select the instance type and number of compute node for the warehouse, and then click Create.
CelerData immediately starts deploying the warehouse, during which the warehouse stays in the Deploying state. This may take a few minutes. After deploying the warehouse is complete, the warehouse enters the Running state.
View and manage existing warehouses
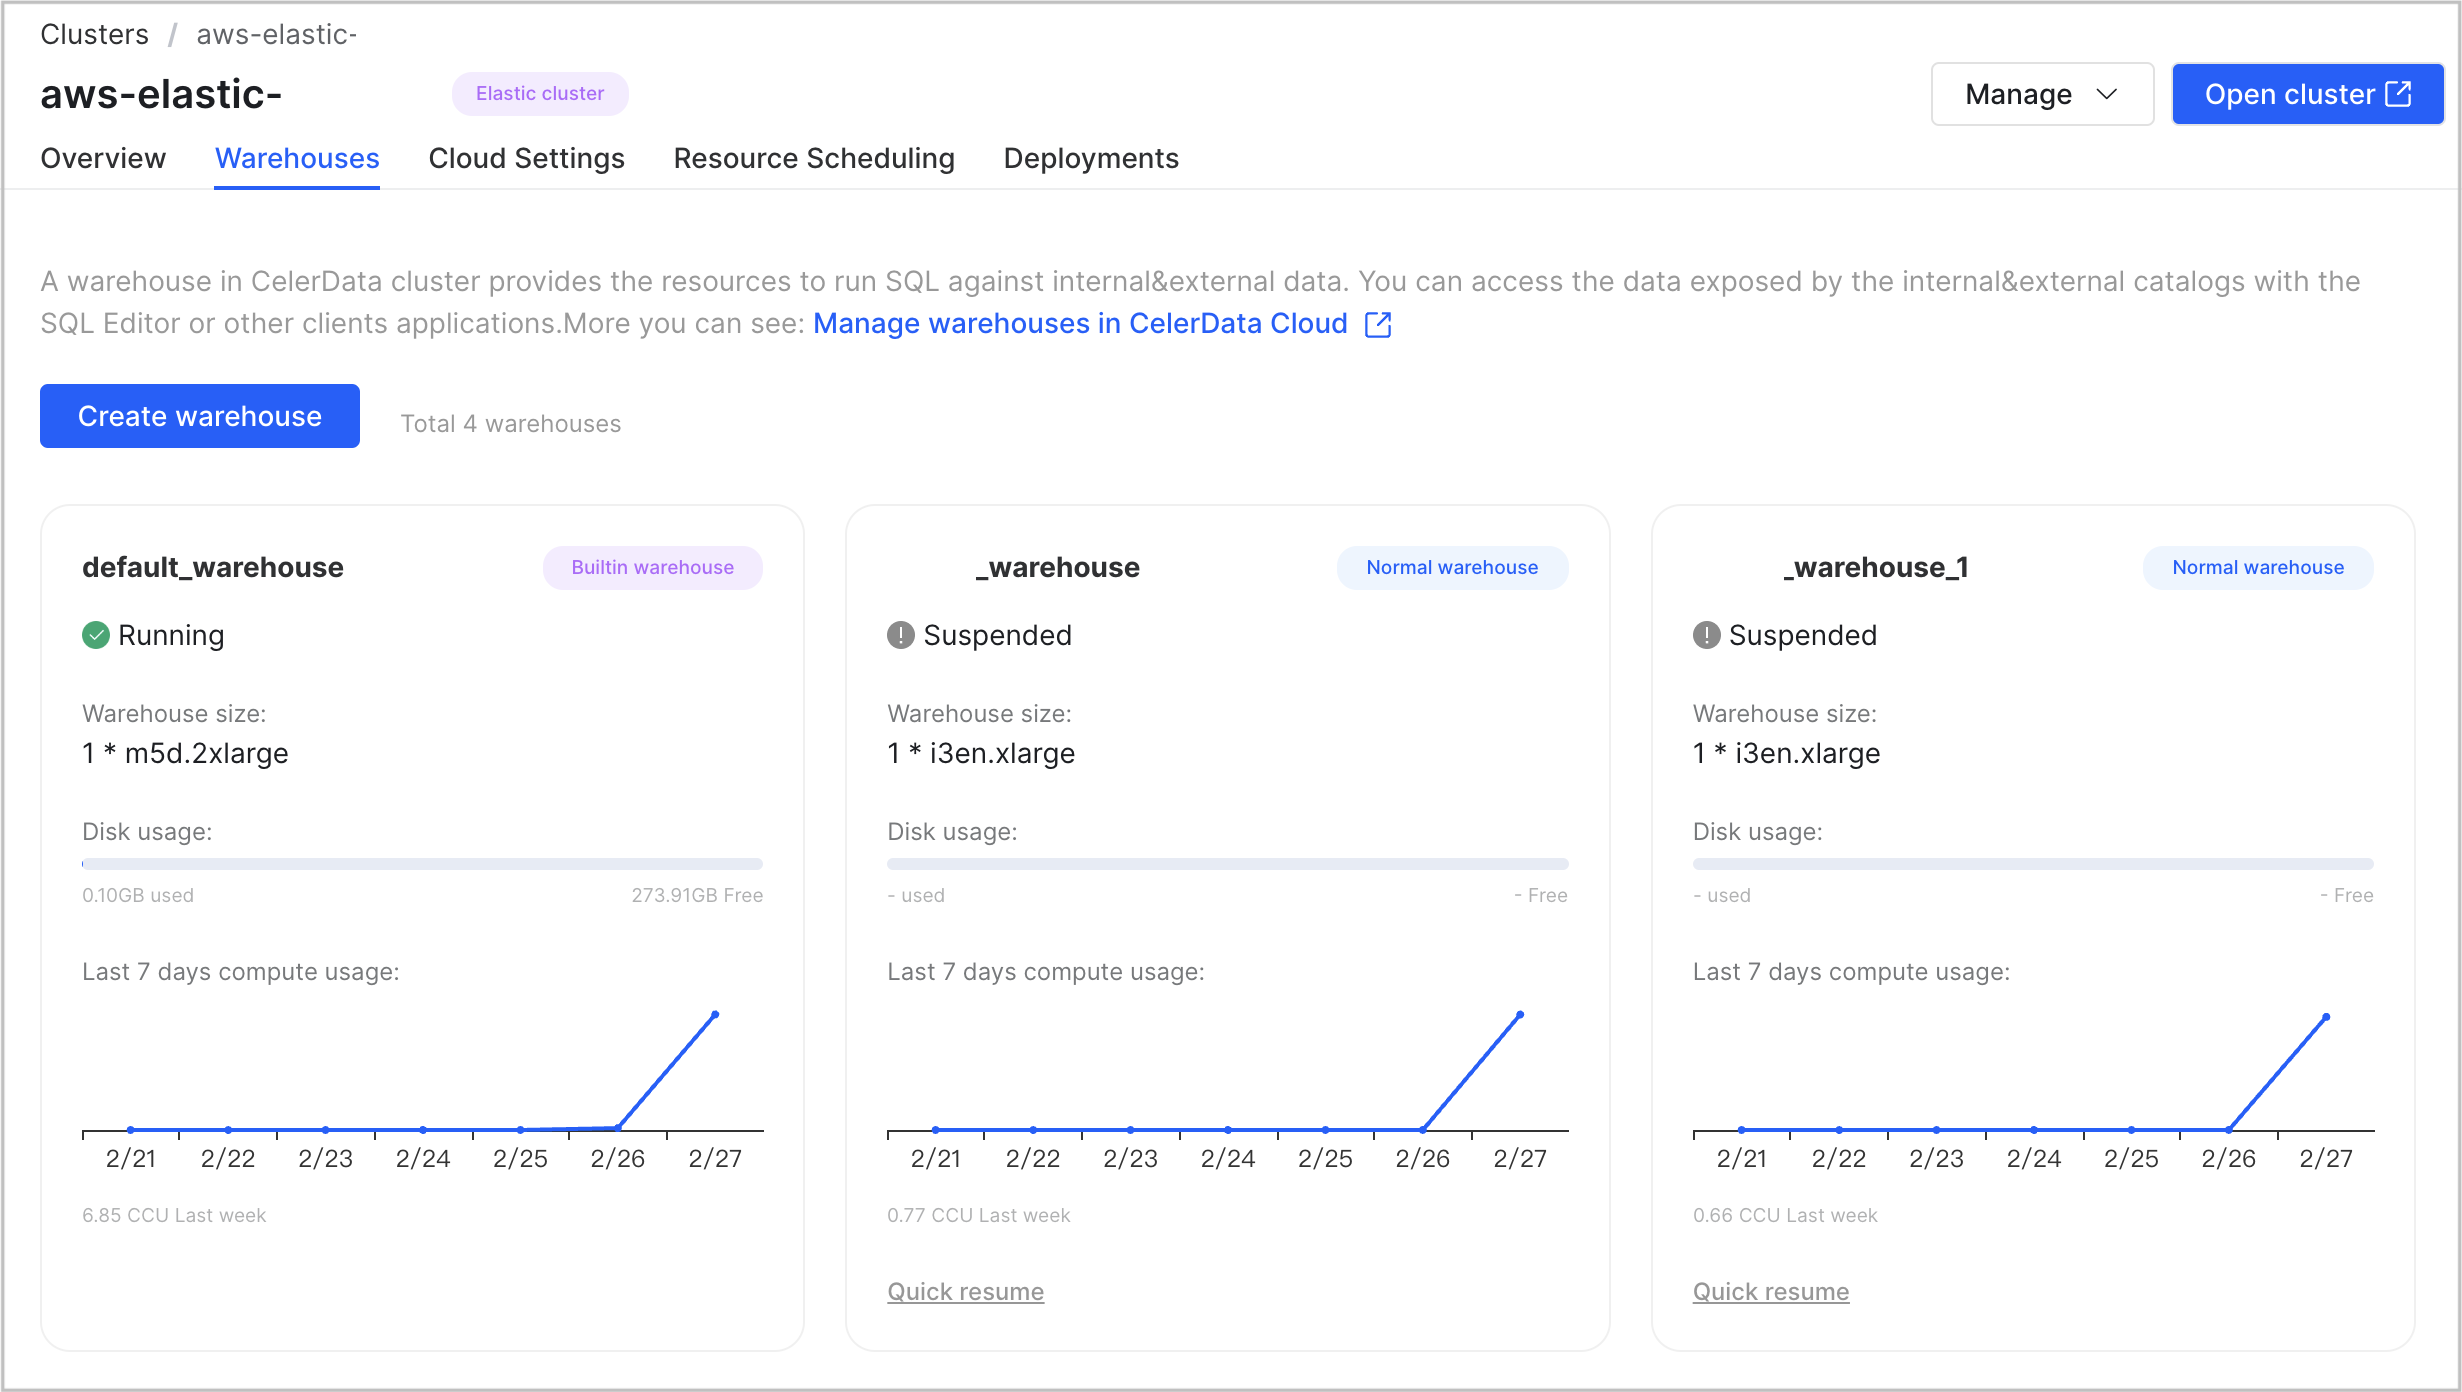
You can view all warehouses created within the cluster. Each warehouse is presented as a card which displays the following warehouse information:
- Status
- Size
- Disk usage
- Compute resource usage over the most recent seven days
You can also manage these warehouses, including:
-
Click Quick suspend or Quick resume in the lower-left corner of the card for a warehouse to suspend or resume the warehouse.
NOTE
The Quick suspend or Quick resume button is displayed only when the cluster is in the Running state. Additionally, you can suspend and resume only the warehouses that you create after the cluster deployment. You cannot suspend or resume the default warehouse that is created along with the cluster.
-
Move the cursor to the lower-right corner of the card for a warehouse to display the View more details button. Click the button to open the warehouse details page on which you can manage the warehouse as needed. For more information, see Manage warehouses.
Cloud Settings
The Cloud Settings tab consists of three sections: Deployment credential, Network configuration, and Data credential. The information in these sections varies depending on the cloud provider of the cluster.
AWS
The Deployment credential section displays the information about the deployment credential that is associated with the cluster, including the following properties.
| Property | Description |
|---|---|
| Credential method | The type of deployment credential that was used to control the permissions of CelerData to launch and manage resources in your AWS cloud. |
| Trust account ID | The account ID that you used to create the IAM role associated with the cluster. NOTE The trust account ID and the external ID are used together to identify the account that can use the IAM role. |
| External ID | The external ID that you used to create the IAM role associated with the cluster. NOTE The trust account ID and the external ID are used together to identify the account that can use the IAM role. |
| IAM role ARN | The ARN of the IAM role that you created to grant CelerData permission to launch and manage resources in your AWS cloud. |
The Network configuration section displays the information about the network configuration that is associated with the cluster, including the following properties.
| Property | Description |
|---|---|
| Subnet ID | The ID of the subnet in which the cluster nodes are deployed for data analysis. |
| Security group ID | The ID of the security group that enables connectivity between cluster nodes within your own VPC and between CelerData's VPC and your own VPC over TLS. |
| VPC endpoint ID | The ID of the VPC endpoint that you created by using End-to-End Private Link to allow direct, secure connectivity between CelerData's VPC and your own VPC. The connectivity is for AWS VPCs in the same AWS region. NOTE A VPC endpoint ID is displayed only when you have configured one for the cluster during the deployment process. |
The Data credential section displays the information about the data credential that is associated with the cluster, including the following properties.
| Property | Description |
|---|---|
| Bucket name | The name of the bucket that is referenced in the data credential. |
| Instance profile ARN | The instance profile ARN of the service IAM role for EC2 that you created to grant CelerData permission to access the referenced bucket. |
Azure
The Deployment credential section displays the information about the deployment credential that is associated with the cluster, including the following properties.
| Property | Description |
|---|---|
| Directory (tenant) ID | The directory (tenant) ID of the registered application. |
| Application (client) ID | The application (client) ID of the registered application. |
| Client secret value | The value of the client secret of the registered application. |
| SSH Key resource ID | The resource ID of the SSH key pair. |
| Updated at | The most recent date and time when the client secret value in the deployment credential was updated. |
The Network configuration section displays the information about the network configuration that is associated with the cluster, including the following properties.
| Property | Description |
|---|---|
| Virtual network resource ID | The resource ID of the virtual network. |
| Subnet name | The name of the subnet that hosts the cluster within the virtual network. |
The Data credential section displays the information about the data credential that is associated with the cluster, including the following properties.
| Property | Description |
|---|---|
| Managed identity resource ID | The resource ID of the managed identity. |
| Storage account name | The name of the storage account. |
| Container name | The name of the container that stores the data of the cluster within the storage account. |
GCP
The Deployment credential section displays the information about the deployment credential that is associated with the cluster, including the following properties.
| Property | Description |
|---|---|
| Credential method | The type of deployment credential that you use to control the permissions of CelerData to launch and manage resources in GCP. |
| Grant access to | CelerData's public service account used to launch and manage resources in GCP. |
| Project ID | The ID of the Google Cloud project that you have created to launch and manage resources in GCP. |
The Network configuration section displays the information about the network configuration that is associated with the cluster, including the following properties.
| Property | Description |
|---|---|
| Subnet name | The name of the subnet that you use to deploy cluster nodes for data analysis. |
| Network tag | The target tag of the firewall rules that you use to enable connectivity between cluster nodes within your own VPC and between CelerData's VPC and your own VPC over TLS. |
| PSC connection ID | The ID of the Private Service Connect endpoint that you create to allow direct, secure connectivity between CelerData's VPC and your own VPC. |
The Data credential section displays the information about the data credential that is associated with the cluster, including the following properties.
| Property | Description |
|---|---|
| Bucket name | The name of your Cloud Storage bucket. |
| Instance service account | The instance service account used to grant CelerData permission to access your bucket. |
Resource Scheduling
On the Resource Scheduling tab, you can:
- View and manage the Auto Suspend feature.
View and manage the Auto Suspend feature
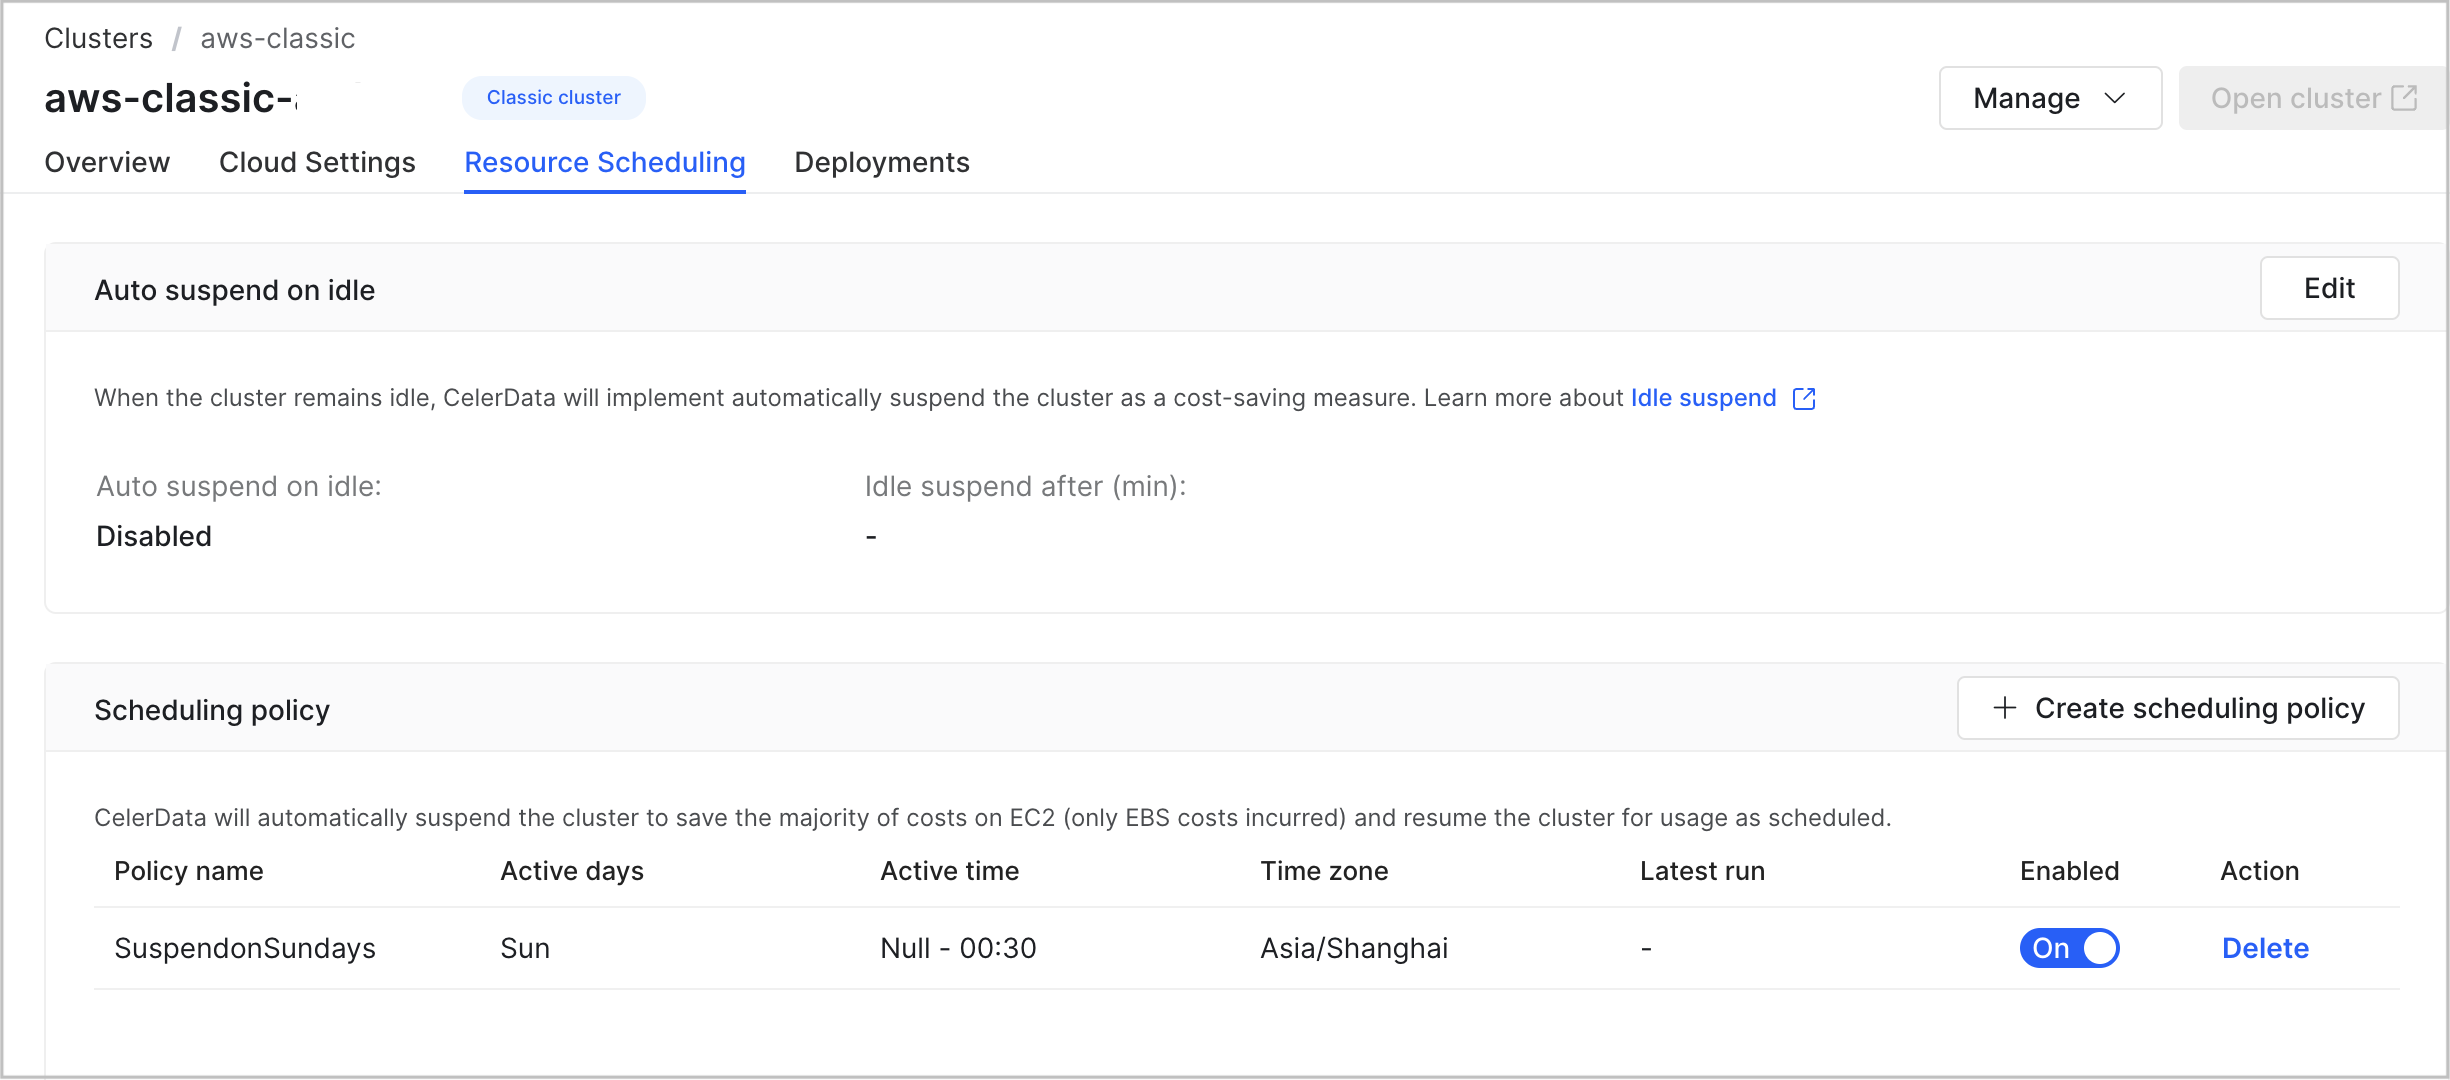
In the Auto suspend on idle section, you can view the setting of the Auto Suspend feature, including the following properties.
| Property | Description |
|---|---|
| Auto suspend on idle | The status of the Auto Suspend feature. Valid values: Enabled and Disabled. |
| Idle suspend after (min) | The maximum amount of time during which the cluster can stay idle. |
You can click Edit in the upper-right area of the Auto suspend on idle section to edit the setting of the Auto Suspend feature.
For more information about the Auto Suspend feature, see Auto suspend on idle.
Deployments
On the Deployments tab, you can:
-
Track cluster events.
-
View cluster nodes.
Track cluster events
Click View cluster event in the upper-right area of the tab. A dialog box is displayed, showing all operations that were performed on the cluster. You can click OK to close the dialog box.
View cluster nodes
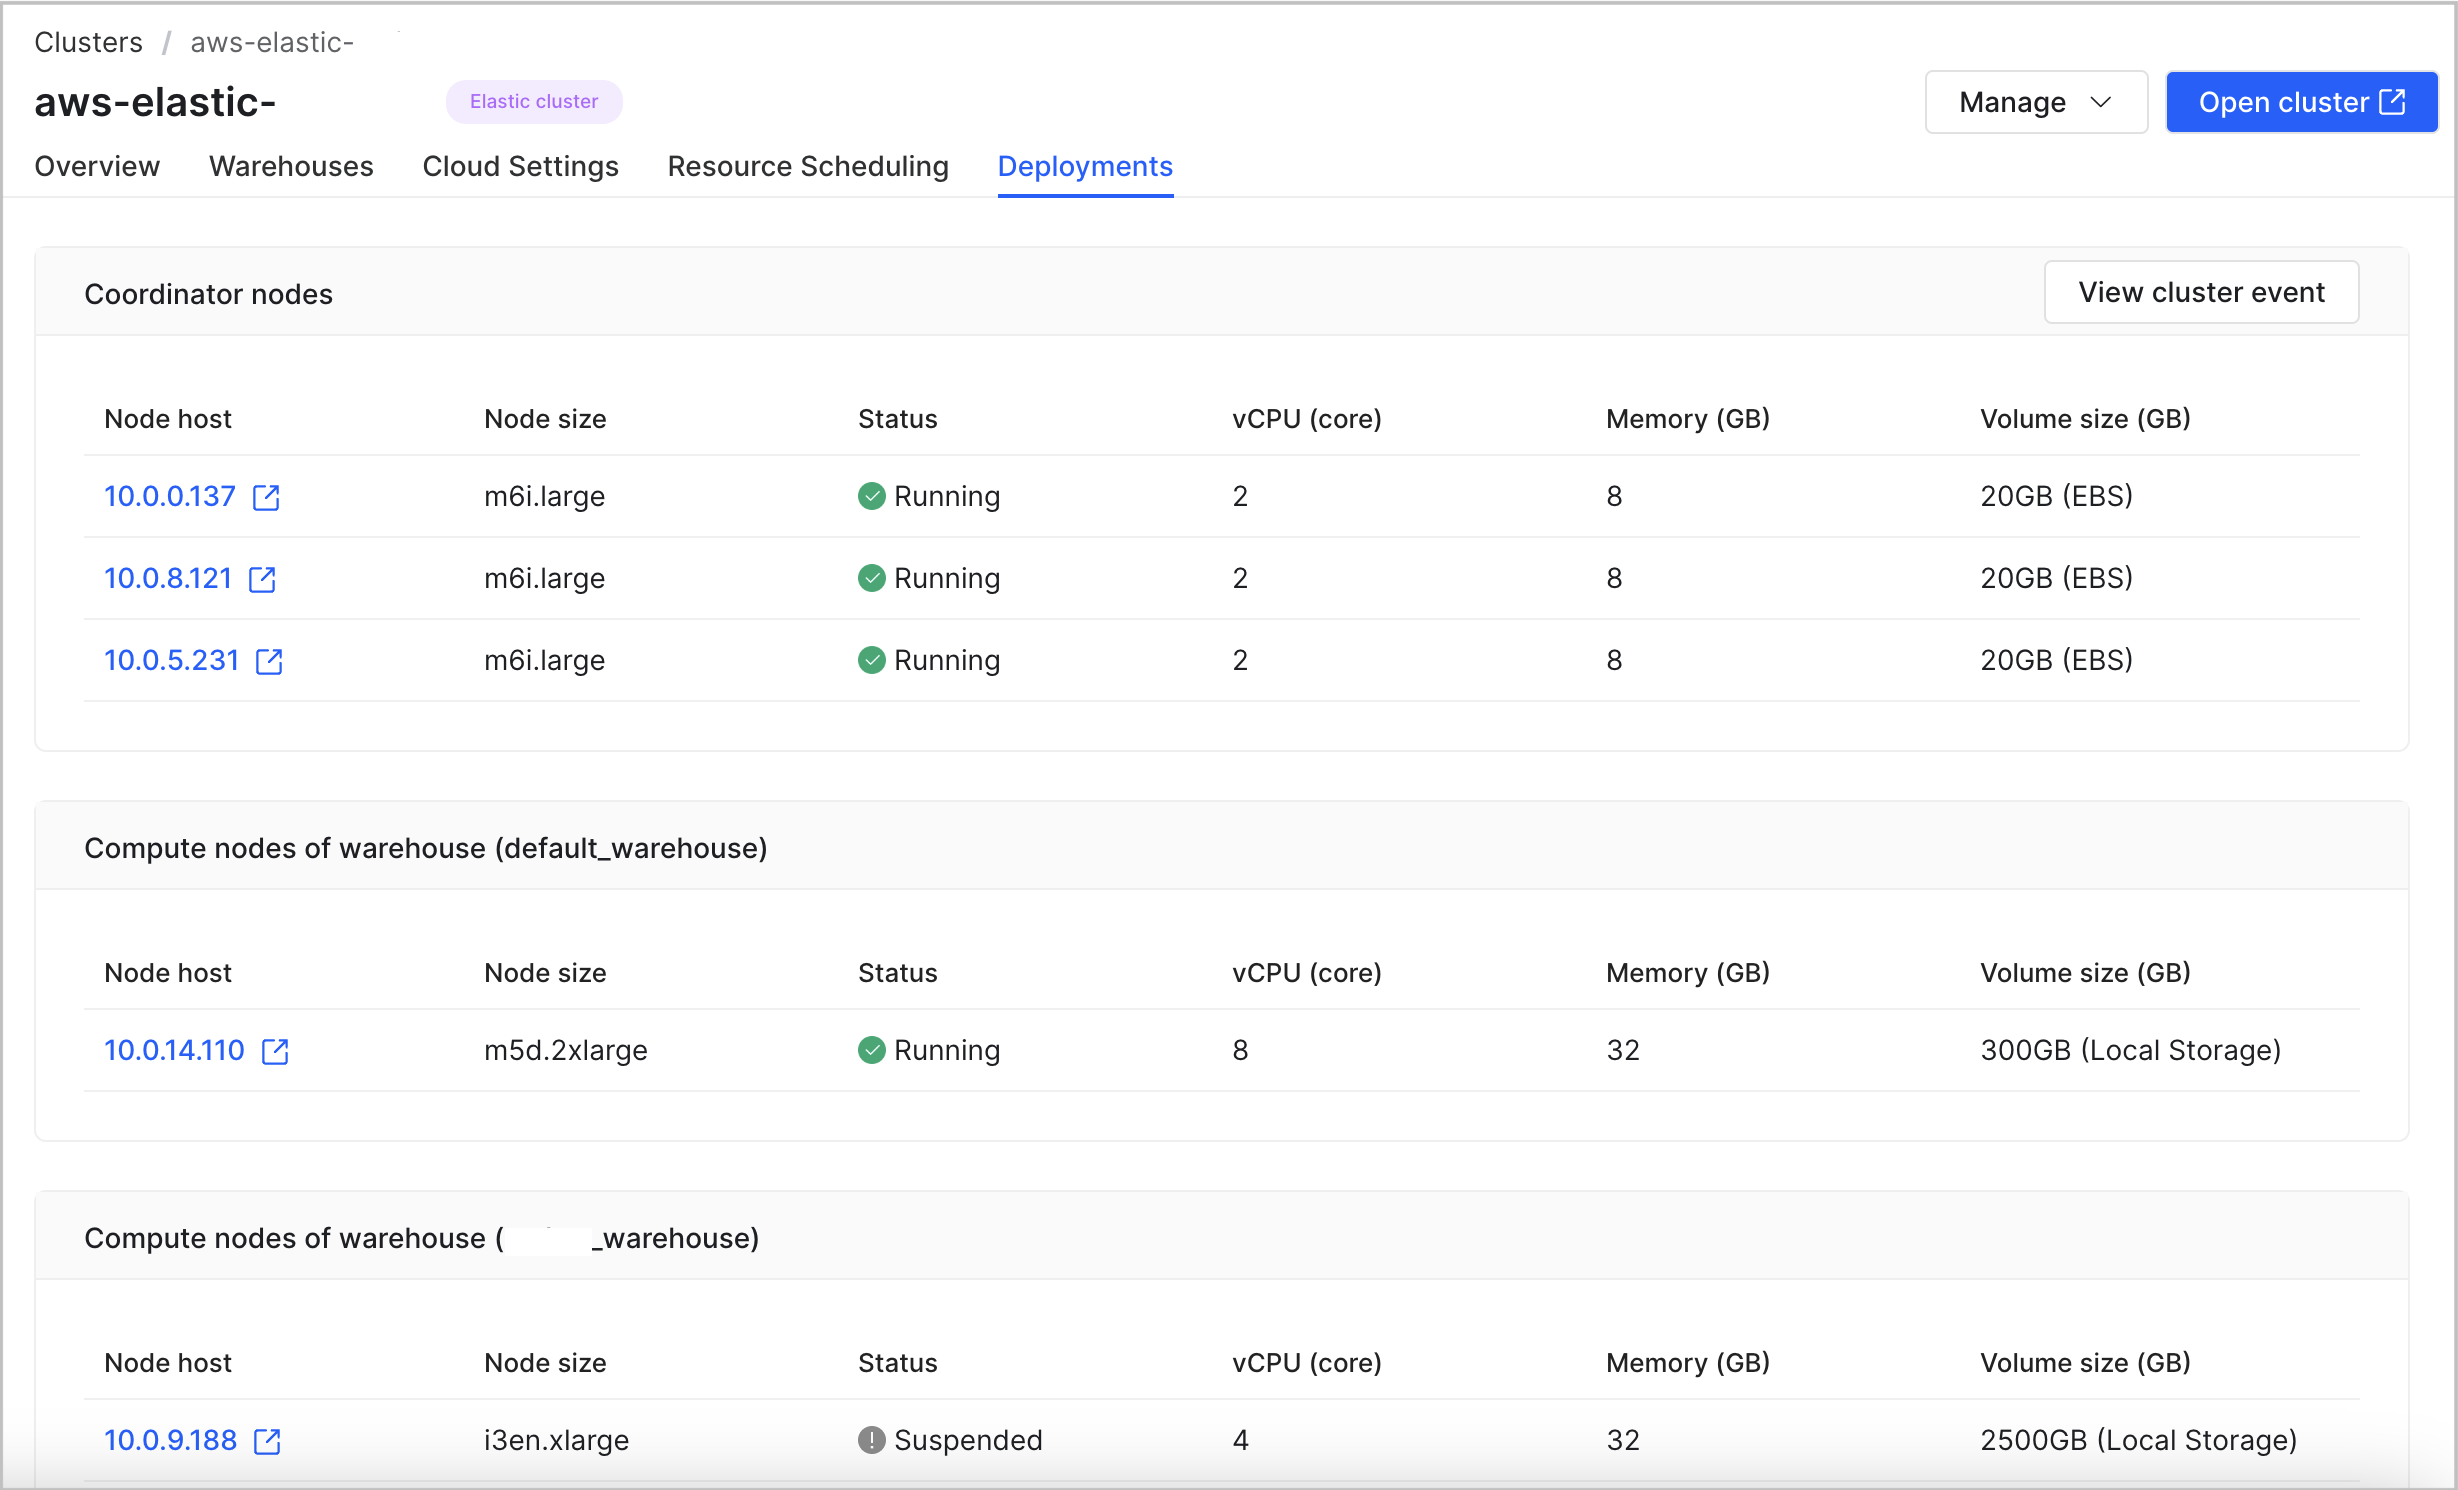
The Deployments tab displays the information about the coordinator nodes and the compute nodes of each warehouse in the cluster, including the following properties.
| Property | Description |
|---|---|
| Node host | The IP address of the coordinator or compute node in the cluster. |
| Node size | The instance type of the coordinator or compute node in the cluster. |
| Status | The status of the coordinator or compute node in the cluster. Valid values:
|
| vCPU (core) | The number of vCPU cores provided by the coordinator or compute node in the cluster. |
| Memory (GB) | The amount of memory provided by the coordinator or compute node in the cluster. |
| Volume size (GB) | The size per volume provided by the coordinator or compute node in the cluster. |
Cluster parameters
On the Cluster parameters tab, you can:
- Configure static parameters for nodes in the cluster.
- Manage resource tags for the cluster.
- Apply Apache Ranger integrations.
- Set cluster maintenance time window.
- Upload SSL certificate for the LDAP integration.
- Manage cluster access for CelerData personnel.
- Enable or disable Termination Protection.
Configure static parameters
For detailed instructions, see Configure static parameters.
Manage resource tags
-
Click Edit in the AWS Tags or GCP Labels section.
- To add a new tag/label to the cluster, click Add tag/label, and enter the Tag/Label Key and Value.
- To modify a tag/label of the cluster, click the modify button, enter the new Tag/Label Key and Value, and click the save button.
- To delete a tag/label of the cluster, click the delete button.
NOTE
The built-in labels Vendor, Creator, and ClusterName cannot be modified or deleted.
-
Click Apply to submit the changes.
Apply Apache Ranger integrations
For detailed instructions, see Manage permissions with Apache Ranger.
Set cluster maintenance time window
You can define a window of time during which the technical support team can perform on-demand maintenance and upgrade operations on your cluster.
Click Window of time for software operations and maintenance section, turn on the switch to enable the time window feature, select your timezone from the Time Zone (offset from UTC) drop-down list, select the day of week in the Days field, select the time range in the time drop-down list, and click Apply to submit the changes.
Upload SSL certificate
You can upload you SSL certificate to the cluster from an S3 bucket that can be accessed by your cluster to integrate LDAP with the cluster.
Click Upload SSL cert, enter the full S3 path of the certificate, click Test to check if the cluster can access the certificate, and click Apply to submit the certificate if the test succeeded.
Manage cluster access for CelerData personnel
You can allow or disallow CelerData to access your cluster for support purposes by turning on or off the switch of the Cluster access for CelerData personnel field in the Cluster Configuration section.
Enable or disable Termination Protection
You can enable Termination Protection to prevent the cluster from being deleted accidentally, thus eliminating the risk of data loss. Once Termination Protection is enabled for a cluster, any attempt to delete the cluster will fail and an error will be returned. To delete the cluster, you will need to manually disable Termination Protection first.
You can enable or disable this feature by turning on or off the switch of the Termination Protection field in the Cluster Configuration section.
Security
On the Security tab, you can:
- Manage public access for the cluster with Private Link is enabled.
- Manage IP Access List.
Manage public access with Private Link
You can enable or disable public access for your cluster if Private Link is enabled by turning on or off the switch of the Enable public access field in the Private connectivity using PrivateLink section.
For more information on Private Link, see End-to-End Private Link
Manage IP Access List
For detailed instructions, see Cluster Operation Page Access Control.
Backup and Restore
On the Backup and Restore tab, you can enable Automated Cluster Snapshot for your Elastic cluster.
Currently, only AWS-based and GCP-based Elastic clusters support backup and restoration with snapshots.
Enable Automated Cluster Snapshot
You can enable Automated Cluster Snapshot to allow your cluster to create cluster snapshots periodically for cluster recovery.
You can only enable Automated Cluster Snapshot while the cluster is in the Running state.
-
Click Enable in the Automated Cluster Snapshot section.
-
In the dialog box that appears, configure as follows, and click Confirm:
a. Specify the Snapshot Interval. The default interval is 10 minutes.
b. Select a storage volume for storing the snapshot files in the Storage volume drop-down list. The default storage volume is
builtin_storage_volume, which is created during cluster deployment.noteIf you want to select a different storage volume other than
builtin_storage_volume, make sure that the credential the storage volume referenced has thePutObject,GetObject, andDeleteObjectpermissions on the corresponding bucket. Meanwhile, make sure the data credential used for the cluster deployment has thePutObject,GetObject, andDeleteObjectpermissions on the corresponding bucket.
For details of backup and restoration in Elastic clusters, see Back up and restore cluster.
What's next
With the connection information you have obtained from the cluster details page, you can connect to the cluster from a JDBC driver or a MySQL client or by using the SQL Editor. For more information, see Connect to a CelerData cluster.
You can also operate the cluster to your needs in the CelerData Cloud BYOC console: