Integrate with Existing Prometheus Service
CelerData offers a variety of monitoring solutions. In addition to the recommended DataDog integration, you can also monitor your cluster and virtual machines by integrate it with an existing Prometheus service.
AWS provides service detection ability via the CloudWatch agent. You can integrate the agent with your Prometheus service to collect the metrics of cluster nodes and the EC2 instances that host them.
Enable service detection
Service detection is enabled by default for newly created clusters. For clusters created earlier, please contact the CelerData Support team to upgrade the agent for your clusters.
Configure Prometheus
Modify the Prometheus configuration file prometheus/prometheus.yml to allow Prometheus to collect the metrics.
This file has strict requirements for the format of the content. Please pay special attention to spaces and indentation when making modifications.
-
Add the following section to the file.
global:scrape_interval: 15sscrape_configs:- job_name: 'starrocks'scheme: httpshttp_sd_configs:- url: https://<endpoint-domain>/api/prometheus-sdbasic_auth:username: "<username>"password: "<password>"basic_auth:username: "<username>"password: "<password>"relabel_configs:- source_labels: [__meta_role]regex: (fe|be|cn|node_exporter)action: keep- source_labels: [__meta_node_ip]target_label: instance- source_labels: [__meta_role]target_label: group -
Configure the code section as follows:
a. Replace
<endpoint-domain>with the endpoint of the cluster. For instructions about obtaining the cluster endpoint, see View the Details of a Cluster.b. Replace
<username>and<password>with the username and password of a dedicated cluster user that used to scrape the metrics. The user must have the OPERATE Privilege on the SYSTEM Level. For instructions on creating users and granting privileges, see Manage Users.noteAlthough using a dedicated user for monitoring is recommended, you can still use the cluster
adminuser, which has all necessary privileges. For details of the clusteradminuser, see Deployment on AWS - Configure the cluster credential. -
Save the modifications. After that, you can use
promtoolto verify whether the modification is valid../prometheus/promtool check config prometheus/prometheus.ymlThe following prompt indicates that the check has passed. You can then proceed.
SUCCESS: prometheus/prometheus.yml is valid prometheus config file syntax -
Restart Prometheus to allow the modifications to take effect.
systemctl daemon-reloadsystemctl start prometheus.service
Configure Grafana
Download the corresponding Dashboard template based on the architecture of your cluster and upload it through the Grafana Web UI.
-
Download the Dashboard templates.
- Dashboard template for All Architecture
- Dashboard template for Elastic Cluster - General
- Dashboard template for Elastic Cluster - Starlet
noteThe template file needs to be uploaded through the Grafana Web UI. Therefore, you need to download the template file to the machine you use to access Grafana, not the monitoring node itself.
-
On the Grafana Web UI, configure the Dashboard template.
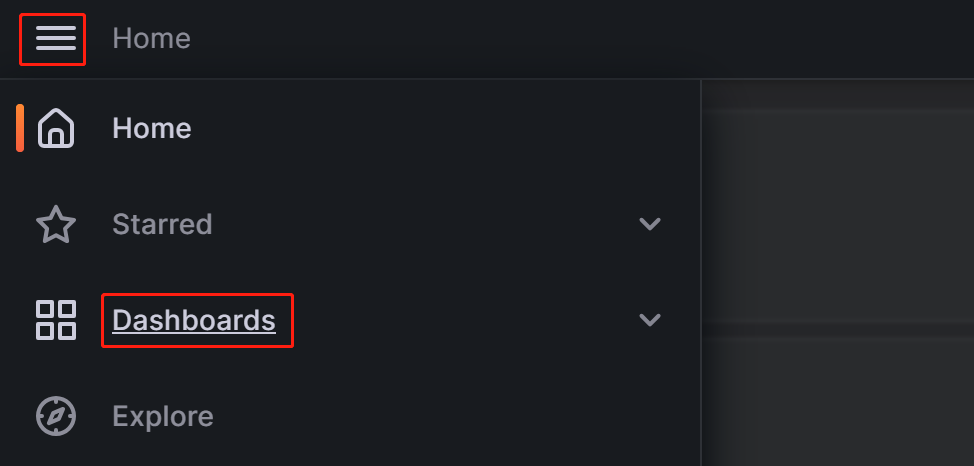
a. Click on the menu button in the upper-left corner and click Dashboards.
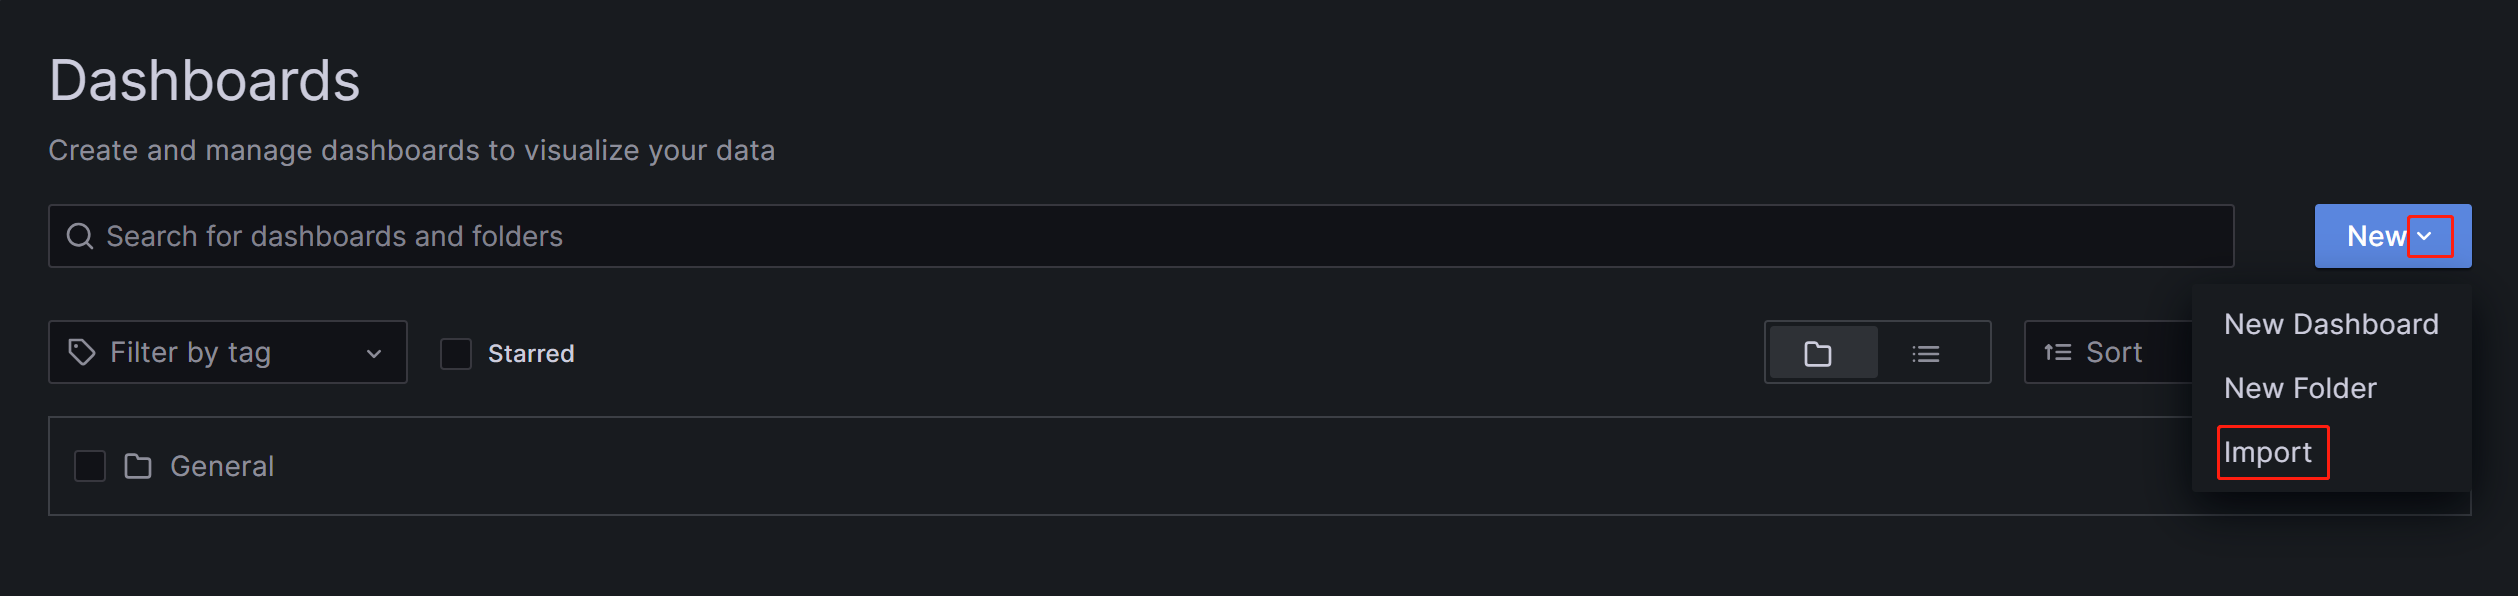
b. On the page that appears, expand the New button and click Import.
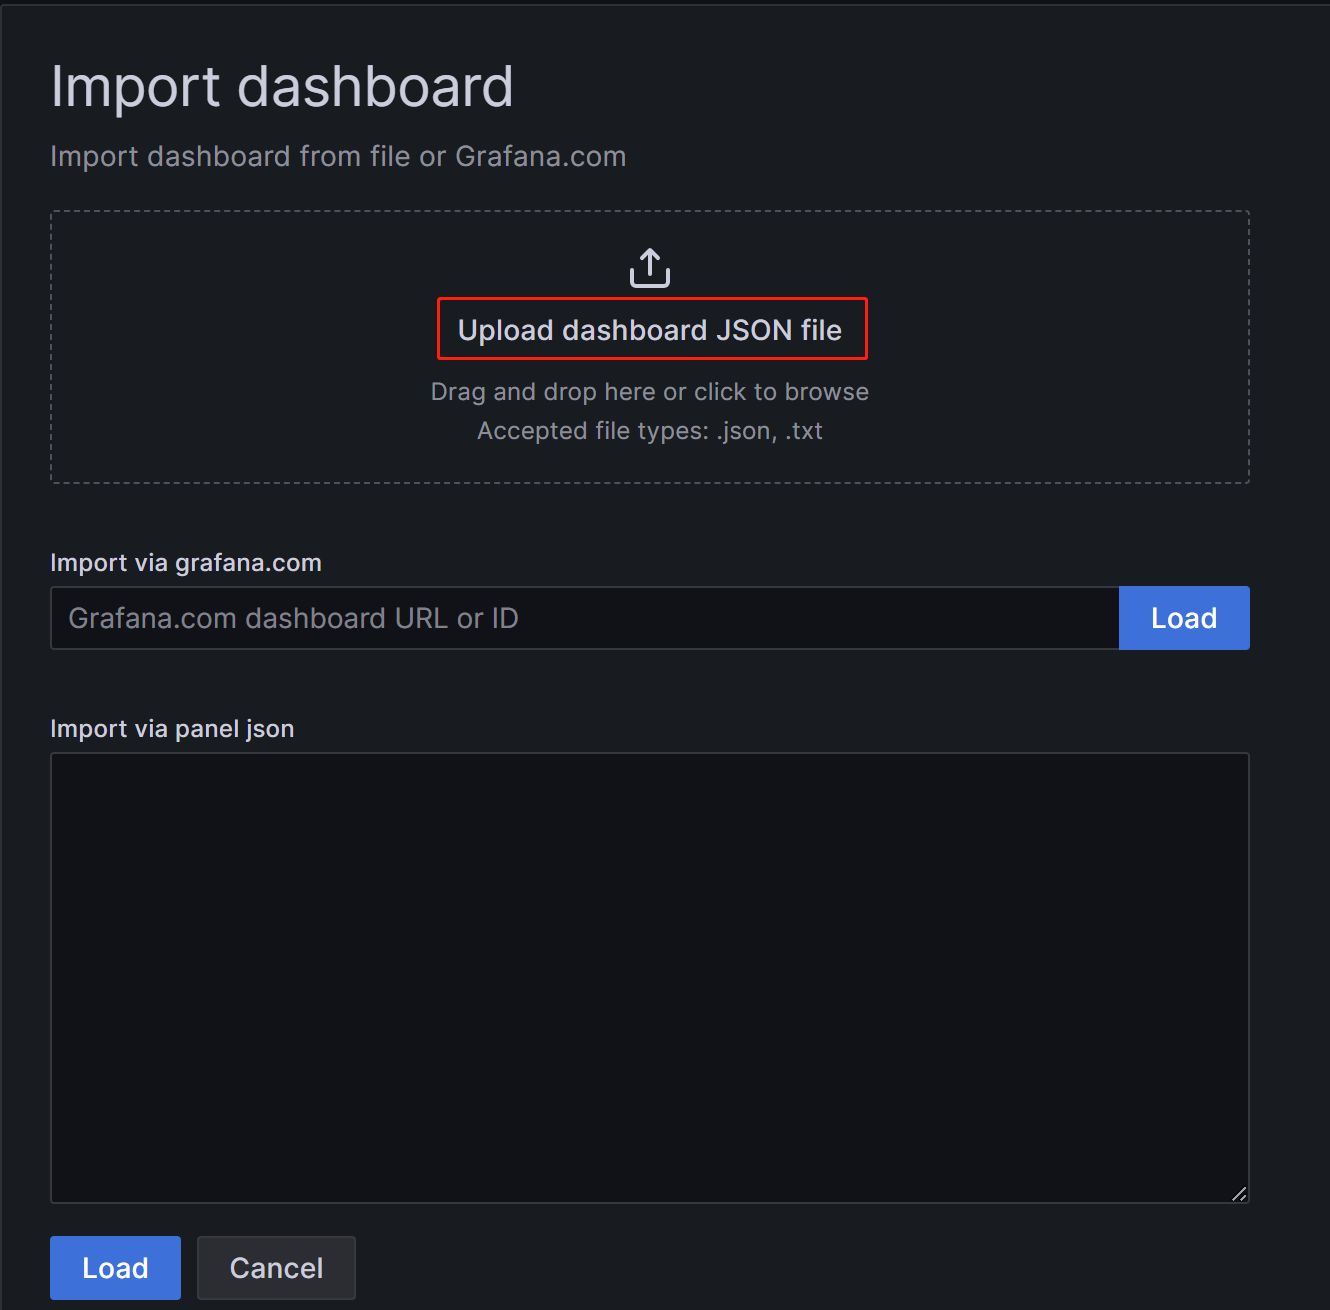
c. On the new page, click on Upload Dashboard JSON file and upload the template file you downloaded earlier.
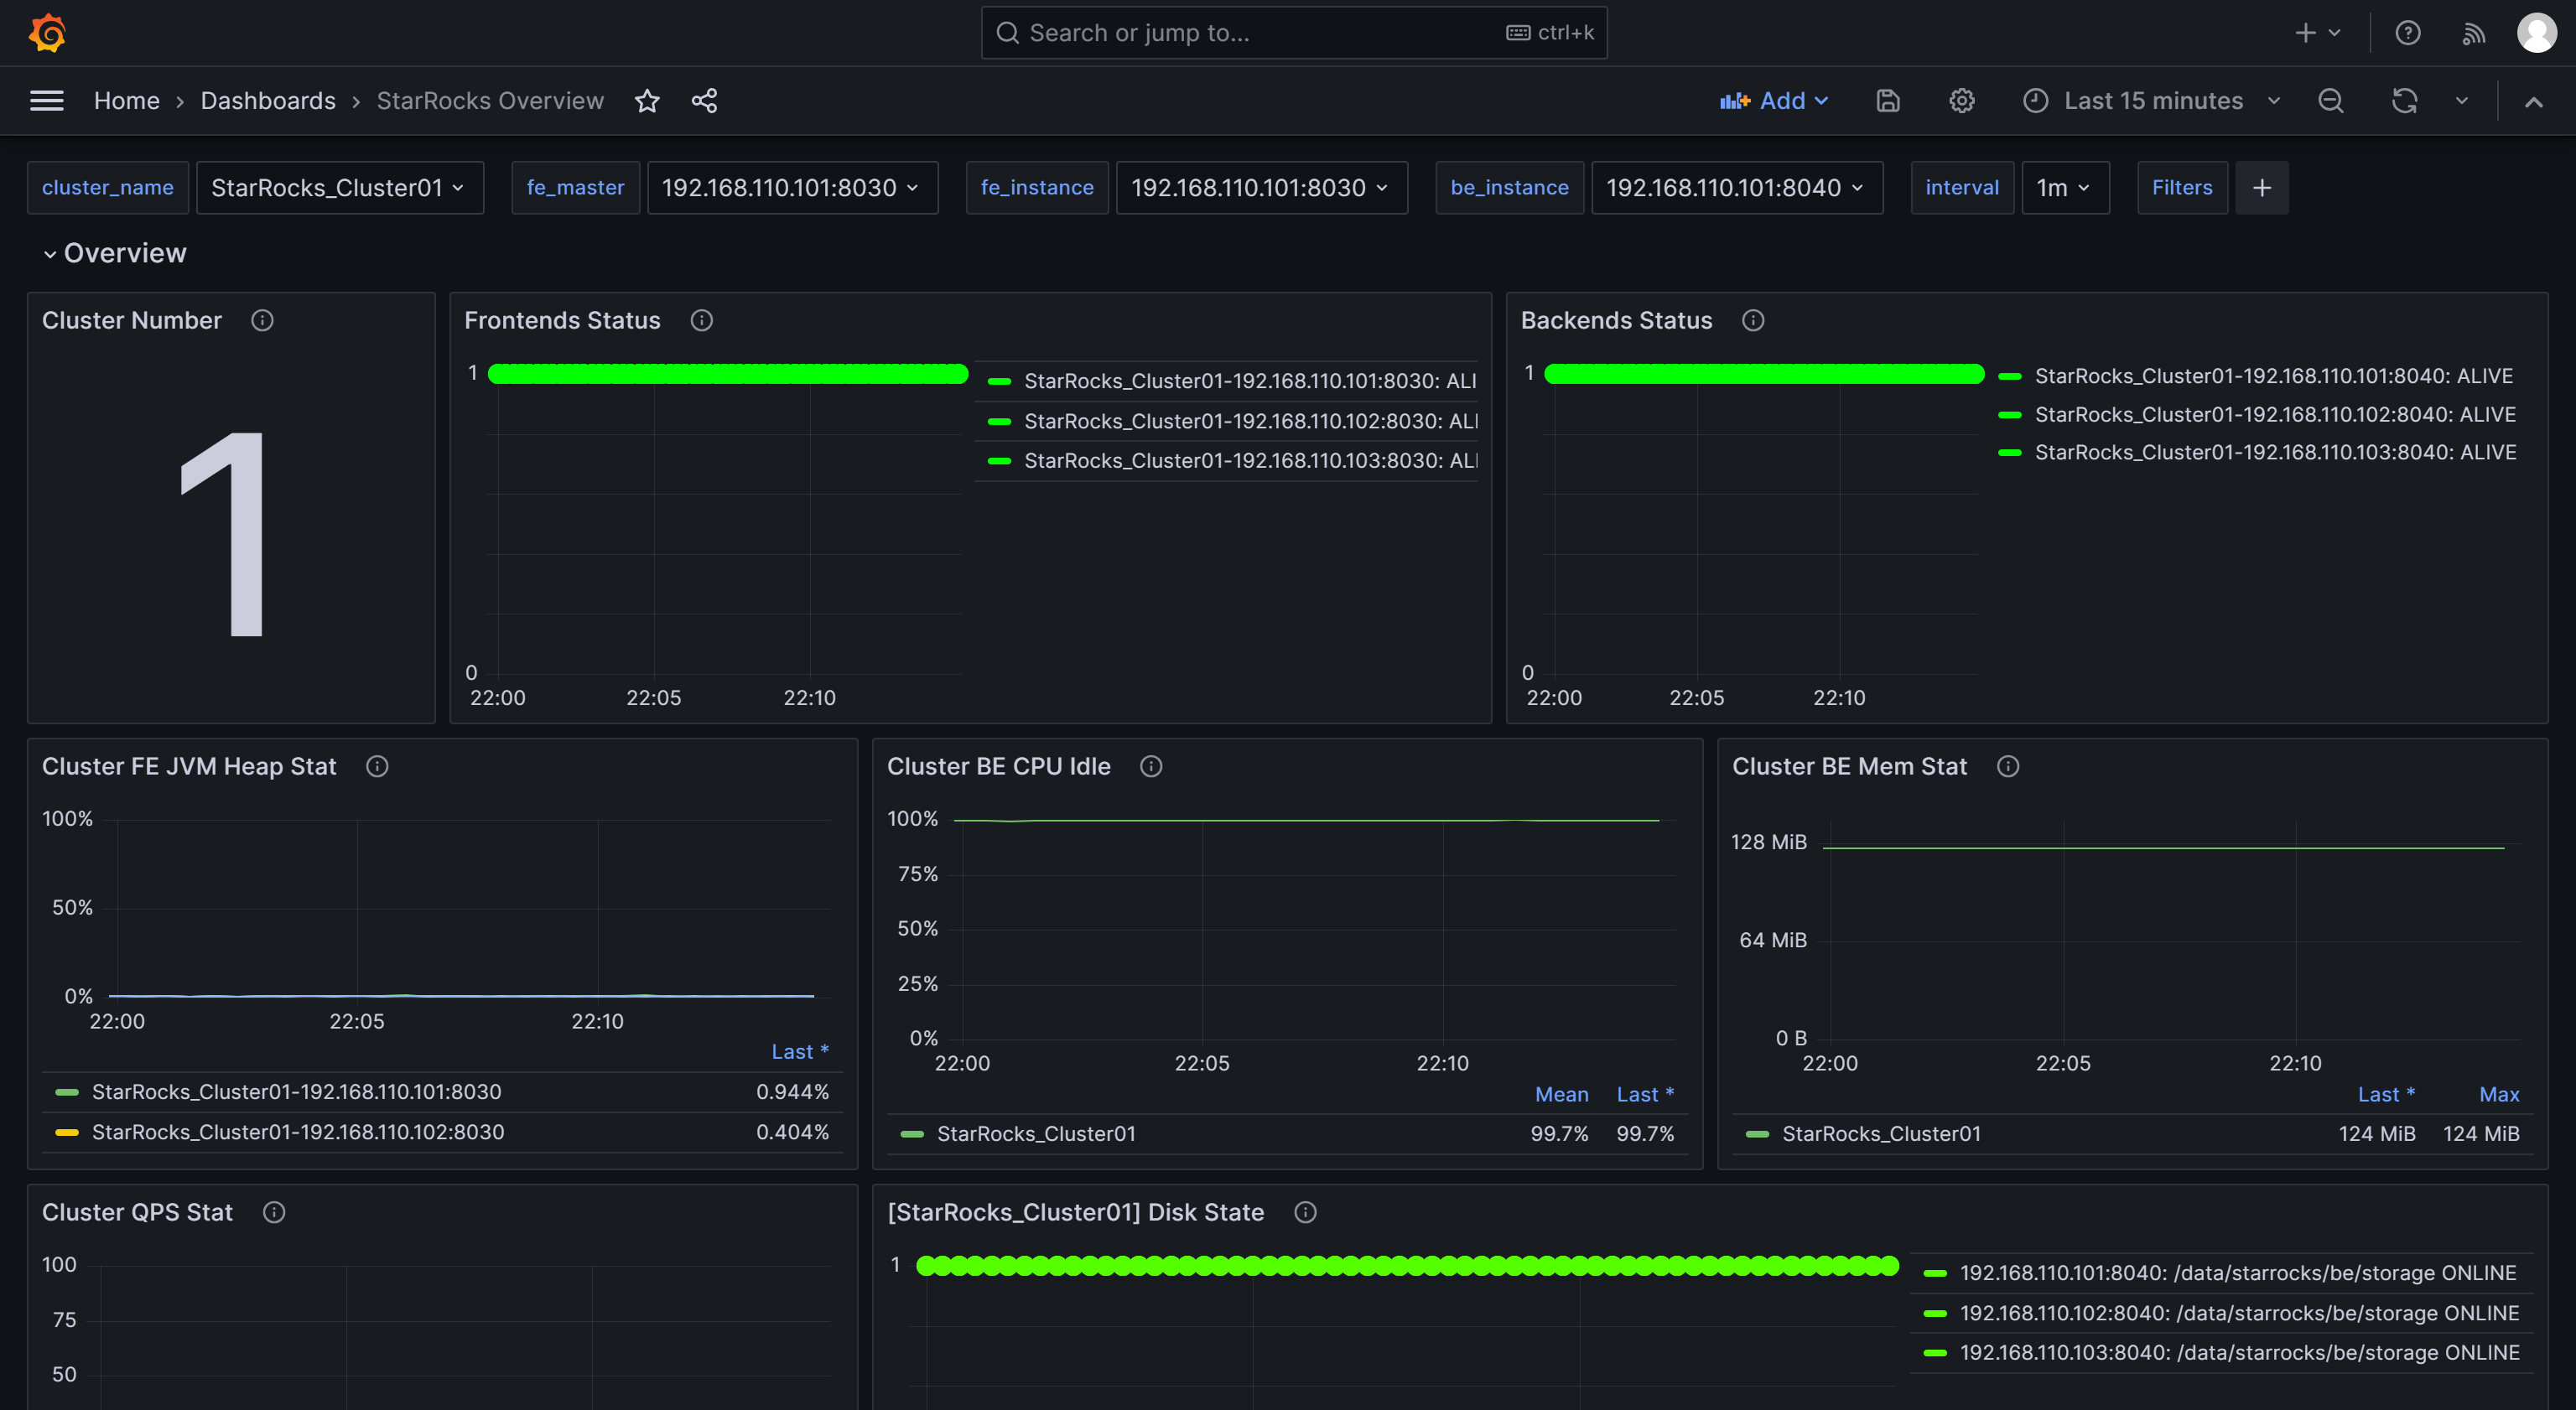
After uploading the file, you can rename the Dashboard. By default, it is named
StarRocks Overview. Then, select the data source, which is the one you created earlier (starrocks_monitor). Then, click Import.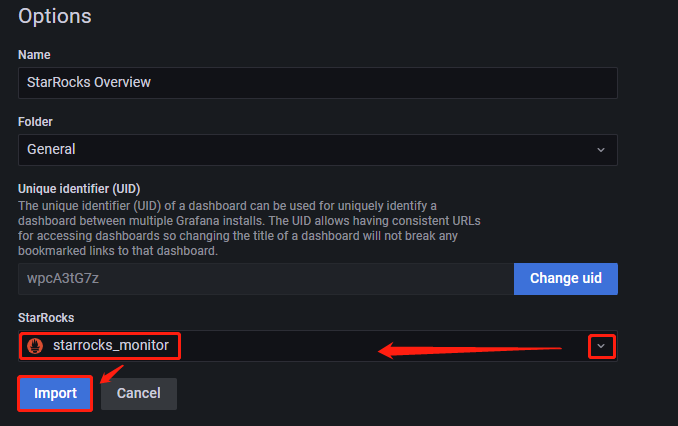
After the import is complete, you should see the StarRocks Dashboard displayed.