Open a CelerData cluster
CelerData supports accessing a CelerData cluster on your web browser. By opening a CelerData cluster on your web browser, you can access CelerData Studio, and run queries, manage data catalogs, view query history, monitor cluster status, and check audit logs in it.
NOTE
- To access CelerData Studio, you must have the View Cluster privilege and the username and password to connect to the cluster.
- CelerData supports setting IP Access List for a cluster to allow or deny access from a specific set of IP addresses.
Open your cluster
-
Sign in to the CelerData Cloud BYOC console.
-
In the left-side navigation pane, choose Clusters.
-
On the Clusters page, click the cluster you want to open.
-
On the cluster details page, click Open cluster.
-
On the Connect to your Cluster page, enter your Username and Password for accessing the cluster, and click Sign in.
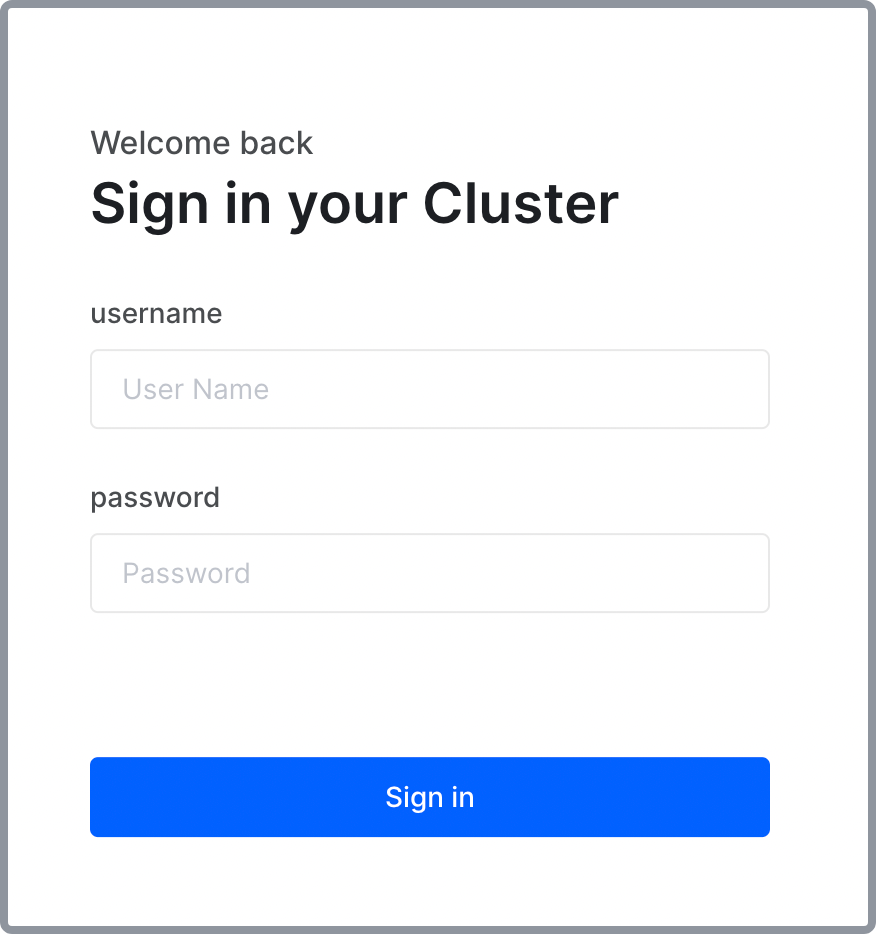
The browser redirects you to CelerData Studio.
CelerData Studio consists of five tabs:
- SQL editor: You can edit and run queries in your CelerData cluster.
- Data catalog: You can view and manage data catalogs within your CelerData cluster.
- Query insight: You can view the query history, audit logs, and active queries to analyze queries in your CelerData cluster.
- System monitoring: You can monitor the status of your CelerData cluster and the instance that hosts it.
- Administrator: You can load audit logs into your CelerData cluster for SQL-based analysis.
Run a query in SQL editor
SQL editor allows you to edit and execute SQL queries on the CelerData platform. It provides an easy-to-use and powerful UI that makes the query-writing more efficient. SQL editor features syntax highlighting and auto-completion. These features provide an intuitive and flexible environment for data analysts, developers, and even business users to quickly work with their data.
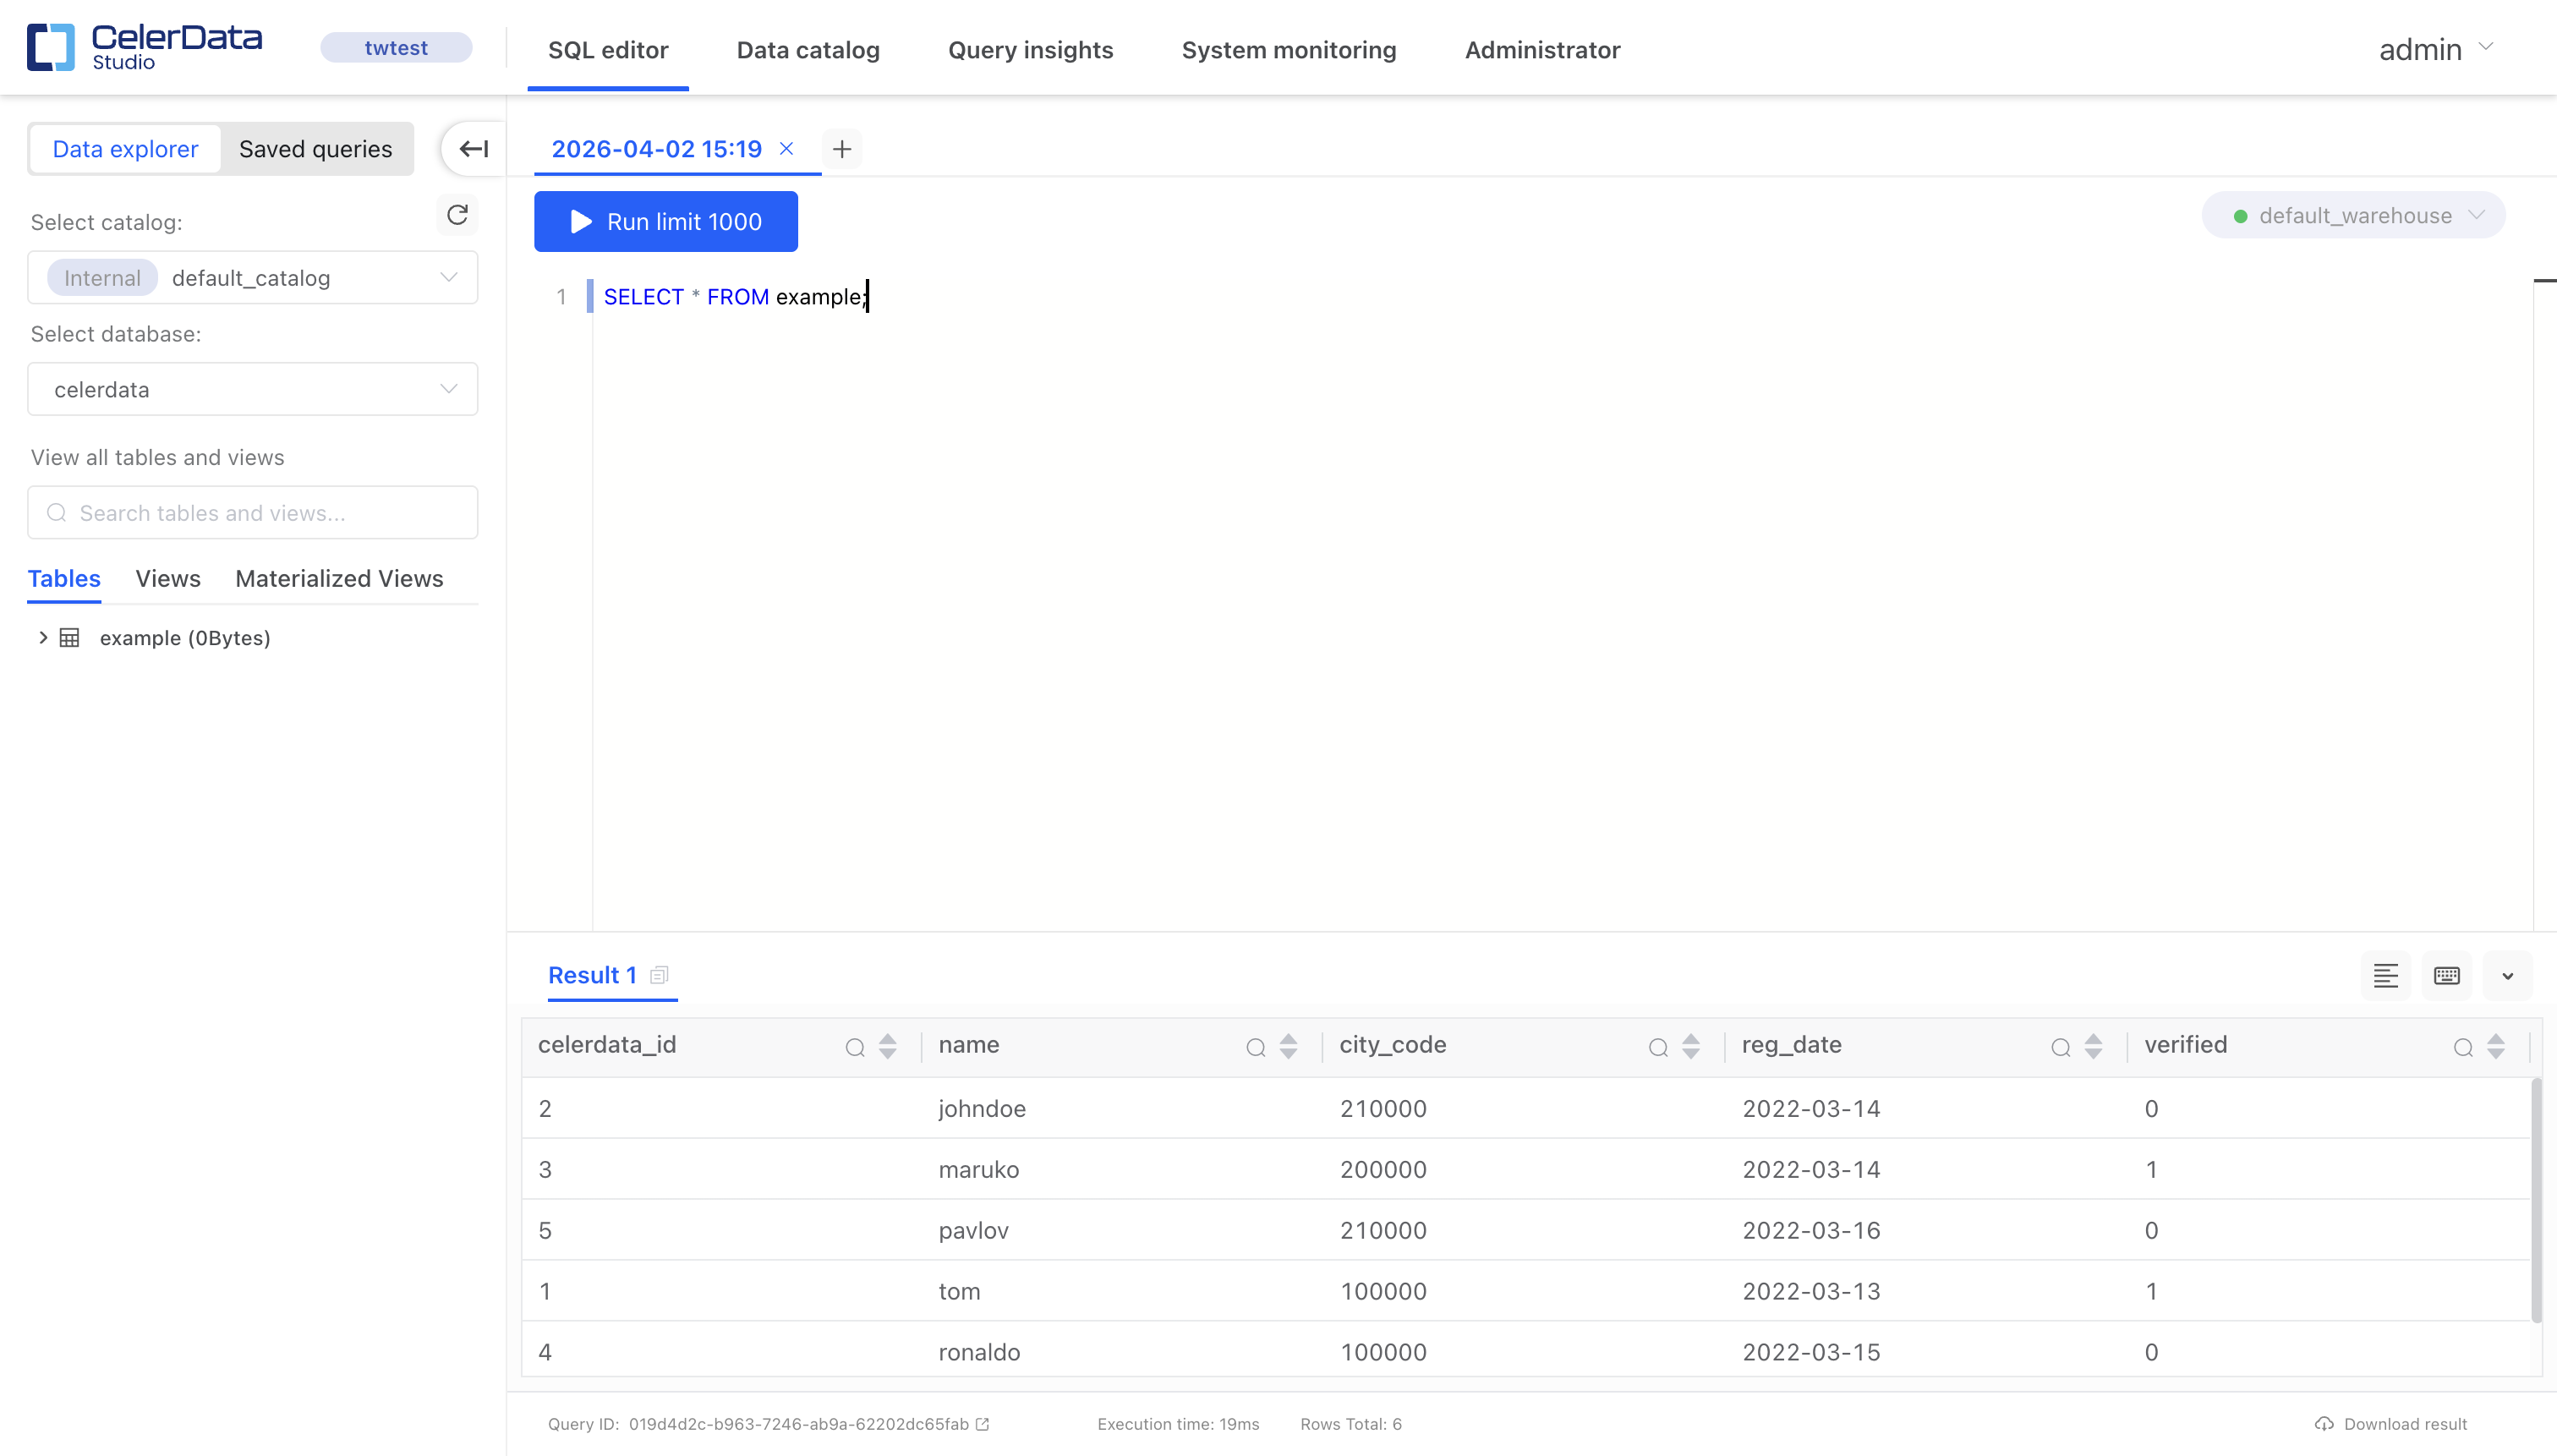
The SQL editor tab consists of three areas:
- The Data explorer and Saved queries panels
- The query editor area
- The query result area
Data explorer and Saved queries panels
On the Data explorer panel, you can:
-
Select the catalog that hosts your data from the Select catalog drop-down list.
-
Select the database that you want to use from the Select database drop-down list. You can select a database only after its parent catalog is selected.
-
View and search for tables in the selected database.
-
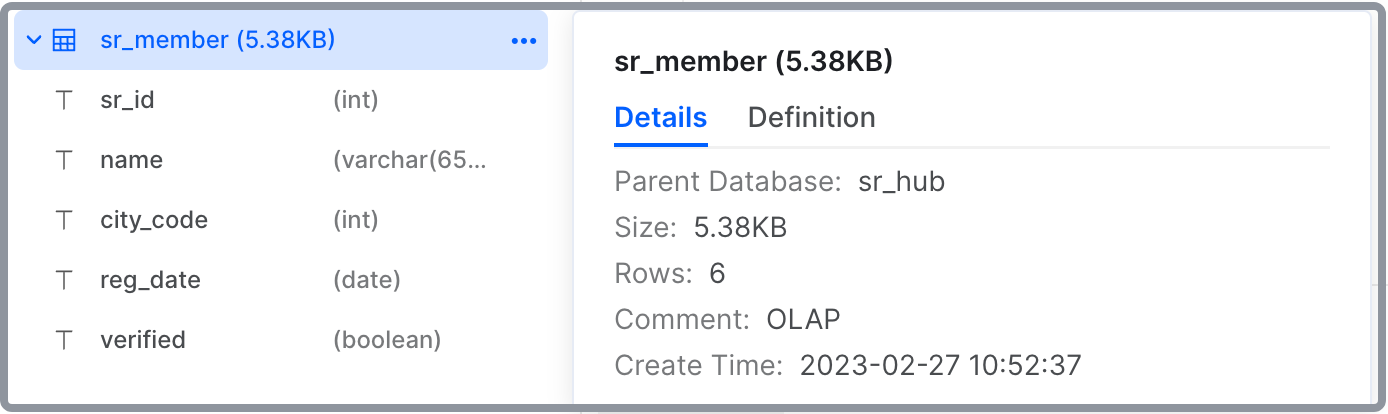
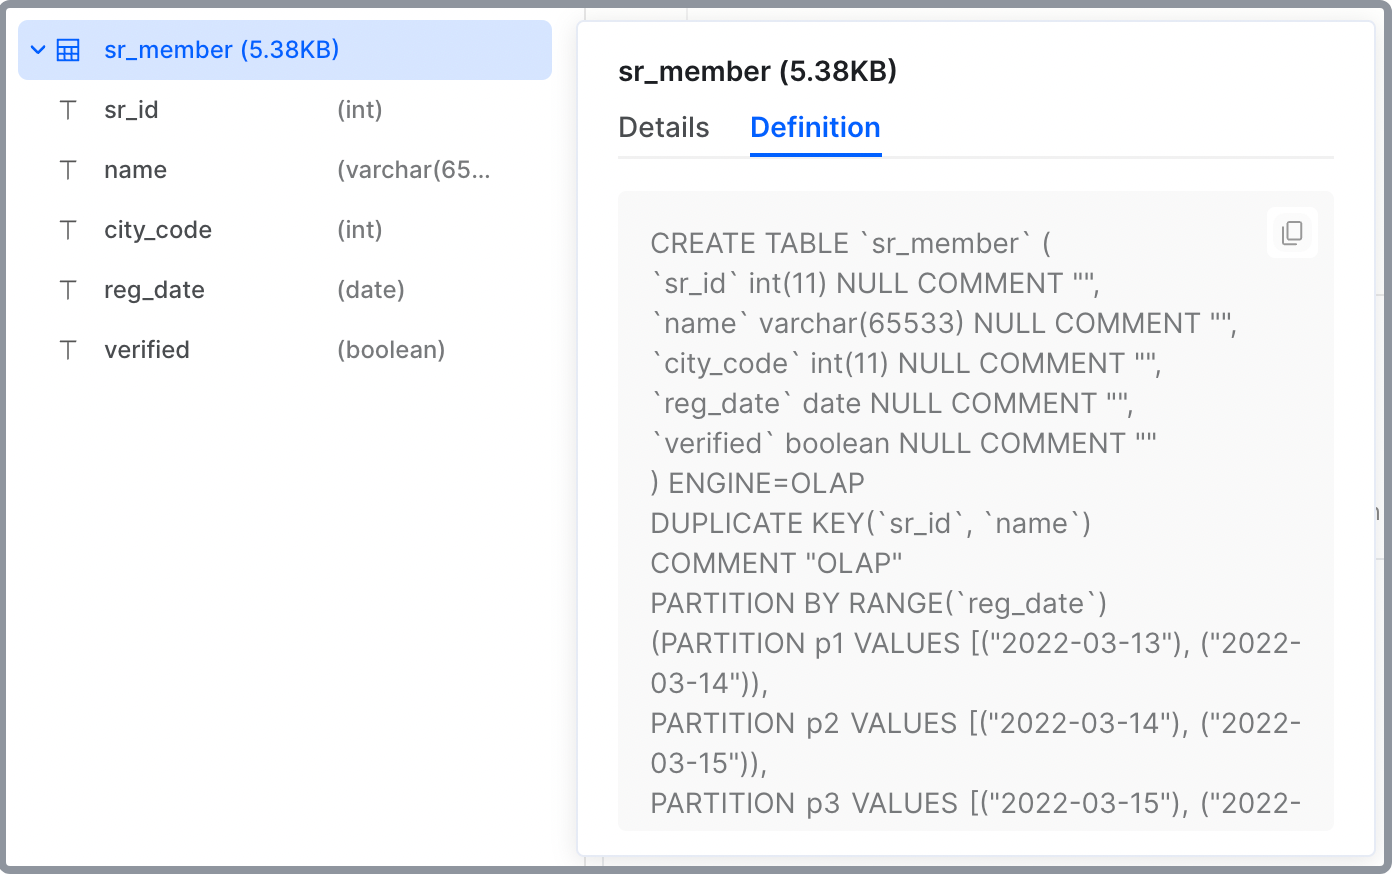
View the Details and Definition of a specific table by hovering on the table.
-
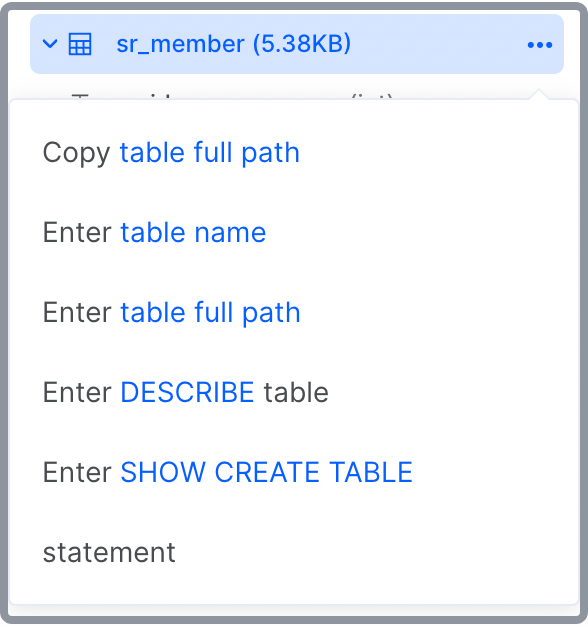
Interact with a specific table by clicking the More (...) button next to the table.
-
View the columns of a specific table by clicking the table.
-
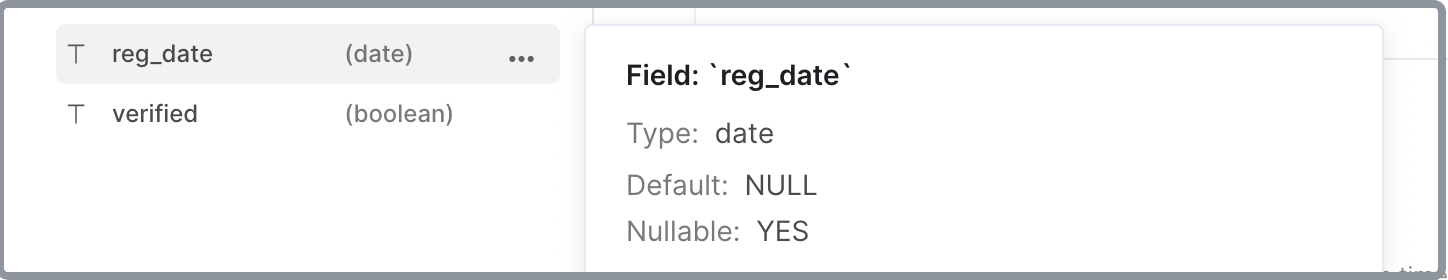
View the details of a specific column by hovering on the column.
-
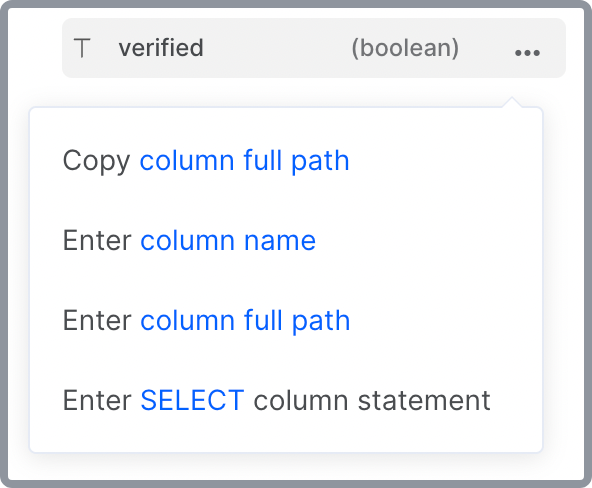
Interact with a specific column by clicking the More (...) button next to the column.
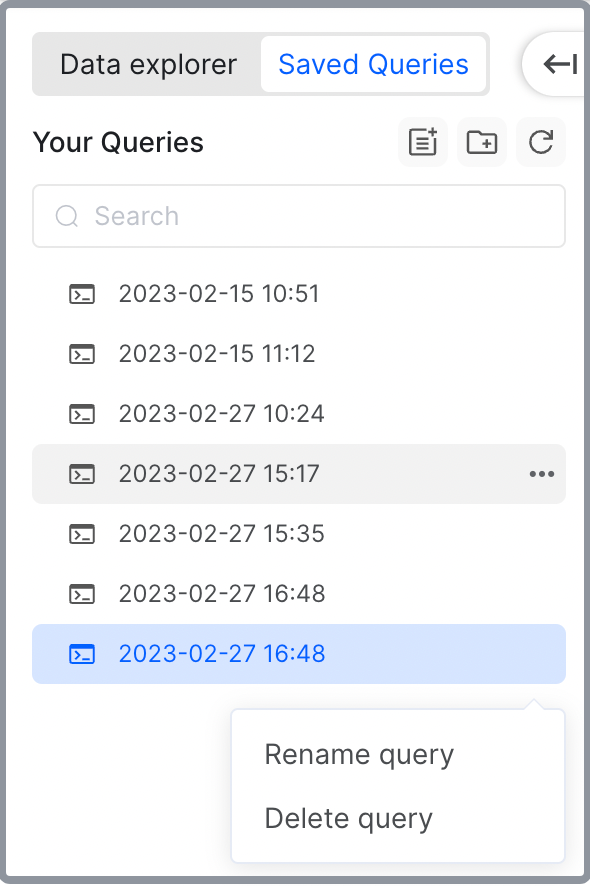
On the Saved queries panel, you can:
-
View and search for saved queries.
-
Load a saved query script by clicking the query.
-
Create a new query script by clicking the Create a new query button.
-
Create a folder to manage your queries by clicking the Create a new folder button.
-
Rename or delete a saved query by clicking the More (...) button next to the query.
NOTE
- Your query script is automatically saved when you edit it.
- Saved queries can be seen among all database users.
Query editor area
In the query editor area, you can:
- Edit a query script in the editor.
- Create a new query script by clicking the + button.
- Run a query script by clicking the Run button.
- Clear the editor by clicking the Clear button and clicking Confirm in the message that appears.
- Format the SQL in the editor by clicking the Format your SQL button.
- Check the keyboard shortcuts the editor supports by clicking the Hot key button.
Query result area
After you run a query script, you can check the details, results, or error message of the query in the query result area.
-
You can check the Query ID, Execution time, and Rows Total of the query in the query status section.

-
You can download the result of the query as an .xlsx file by clicking the Download button after the query is completed.
-
Different information will be displayed in the result section during different phases of the query execution:
-
When the query is running, the result section displays the amount of time that the query has taken.

-
If the query fails, the result section will display the error message.

-
When the query is completed, the result section displays the results of the query.
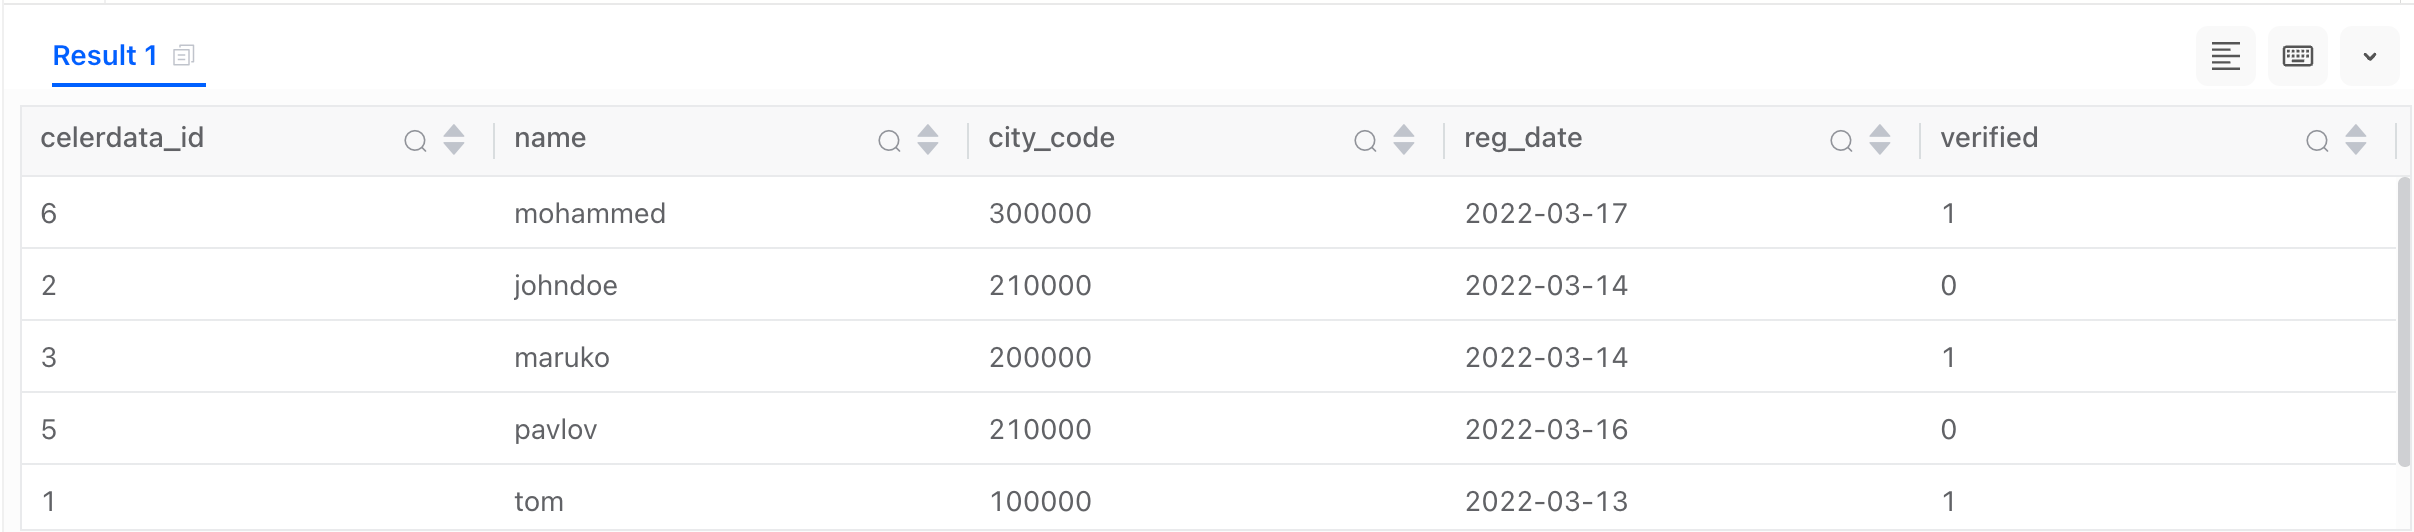
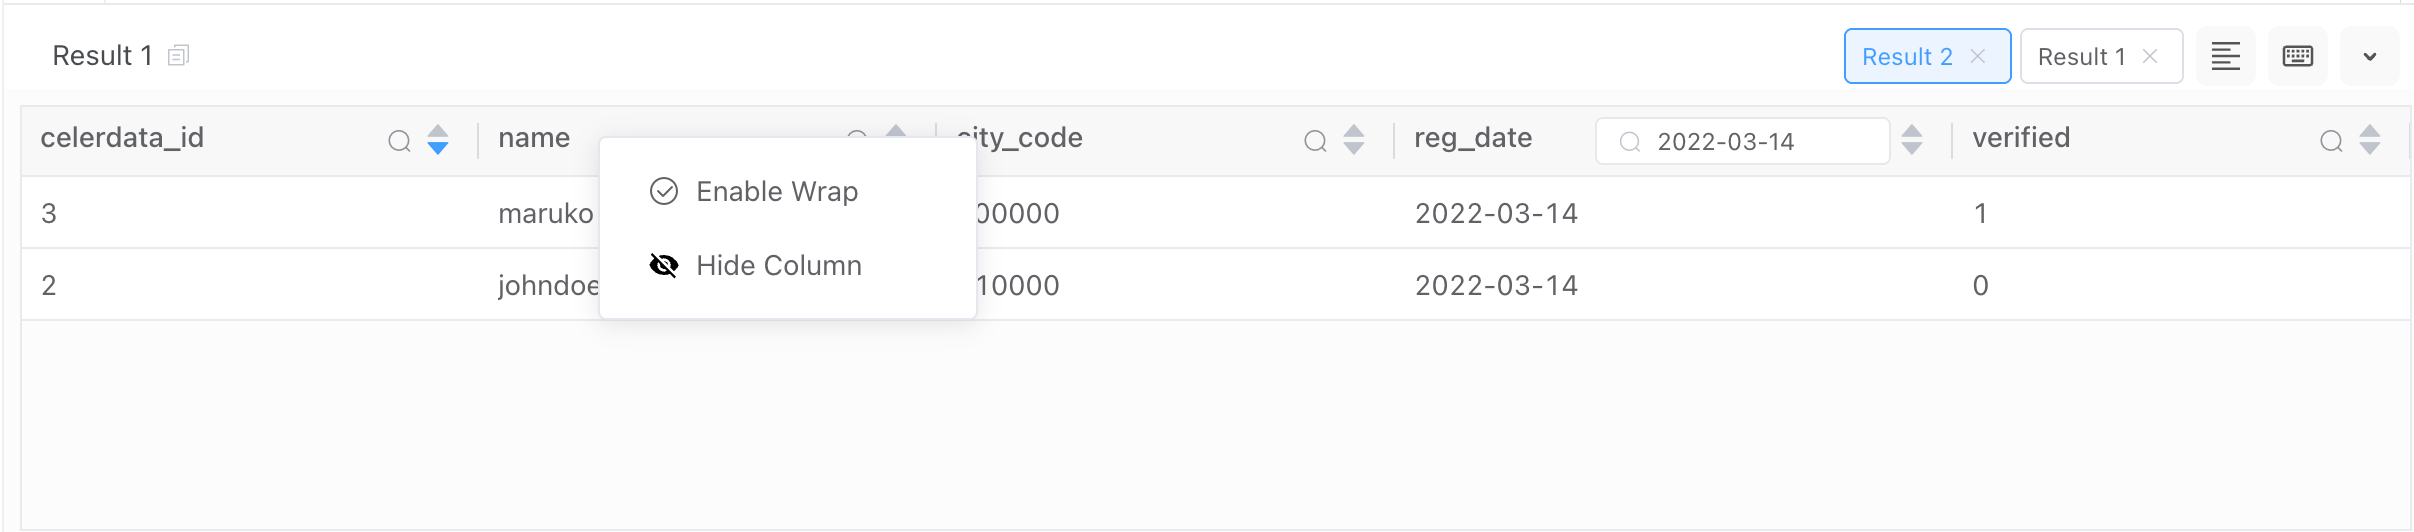
In the result section, you can:
- Resize a column by dragging its boundary.
- Wrap a column by right-clicking the column and selecting Enable Wrap.
- Hide a column by right-clicking the column and selecting Hide Column.
- Sort the results by a column.
- Filter the results by a column.
- Create a tab to save the result layout by clicking the save button next to Result 1. You can create multiple result tabs, and rename the tab by double-clicking it.
-
View and manage your data catalogs
On the Data catalog tab, you can view and manage all data sources of your CelerData cluster, including external catalogs and the internal catalog default_catalog, which contains the self-managed tables created in your CelerData cluster.
Create an external data catalog
On the Data catalog tab, click Add catalog. Follow the deployment wizard to create an external data catalog.
-
Step1: Add new data source
Select a data source, and click Next Step.
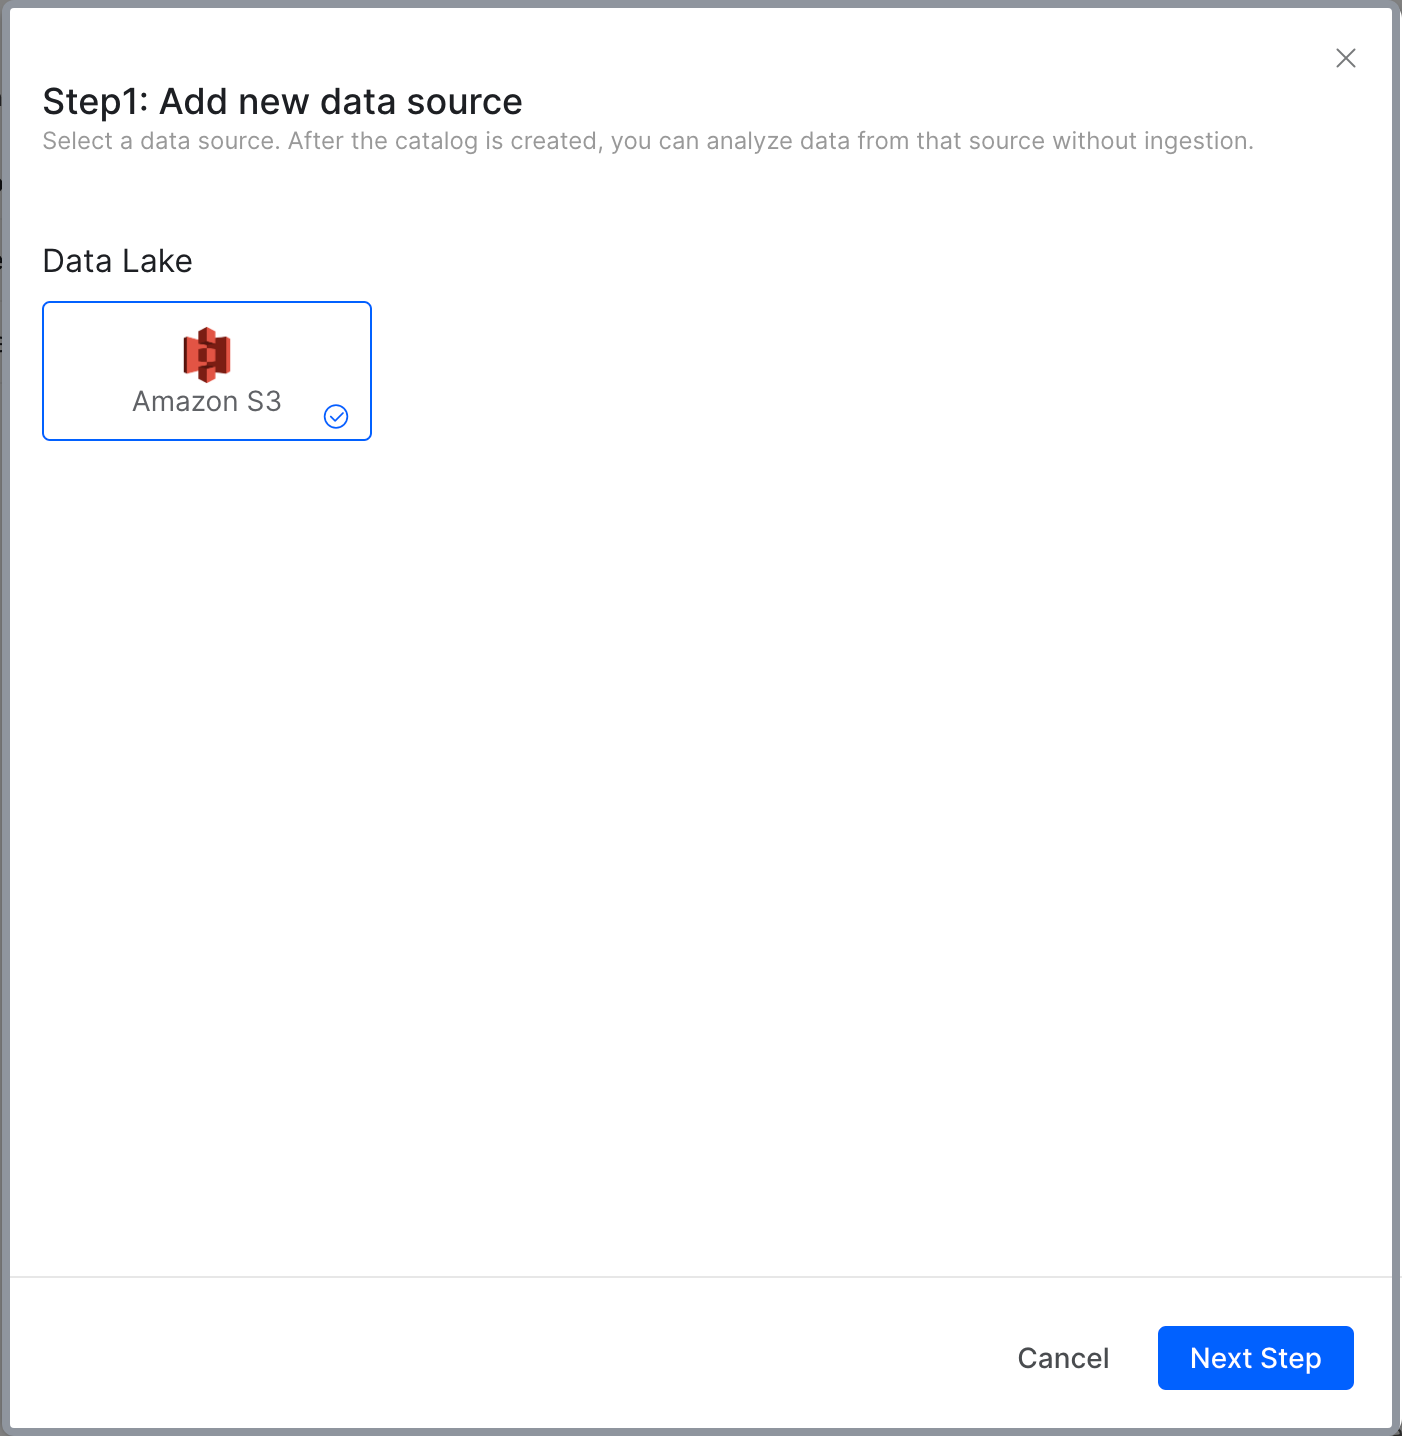
NOTE
Currently, CelerData only supports Amazon S3 as the external data source.
-
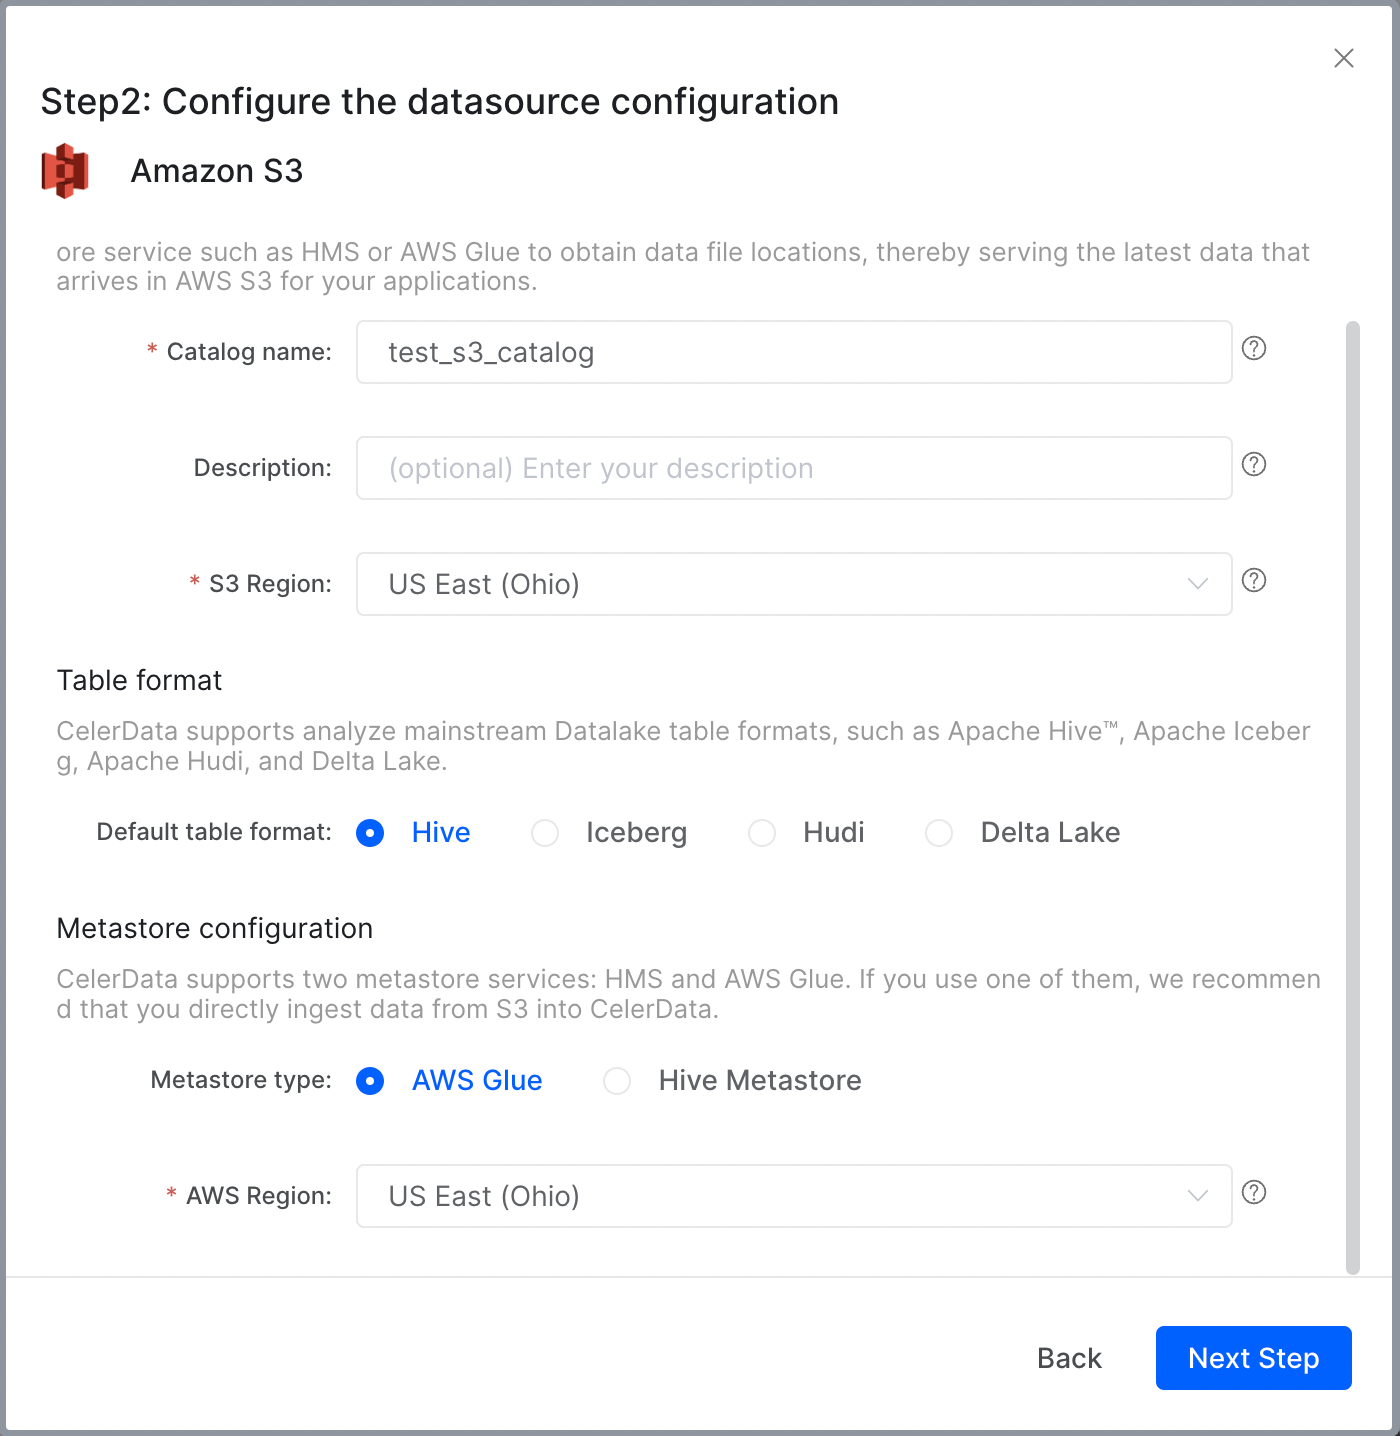
Step2: Configure the data source configuration
Enter the Catalog name, optionally add a Description, choose the S3 Region of your data storage, choose the Default table format, choose your Metastore type, choose the AWS Region of your metastore, and click Next Step.
-
Step3: Configure the authentication information
You can choose Instance profile-based authentication or Assumed role-based authentication to access your data source. For detailed instructions, see Authenticate to AWS resources.
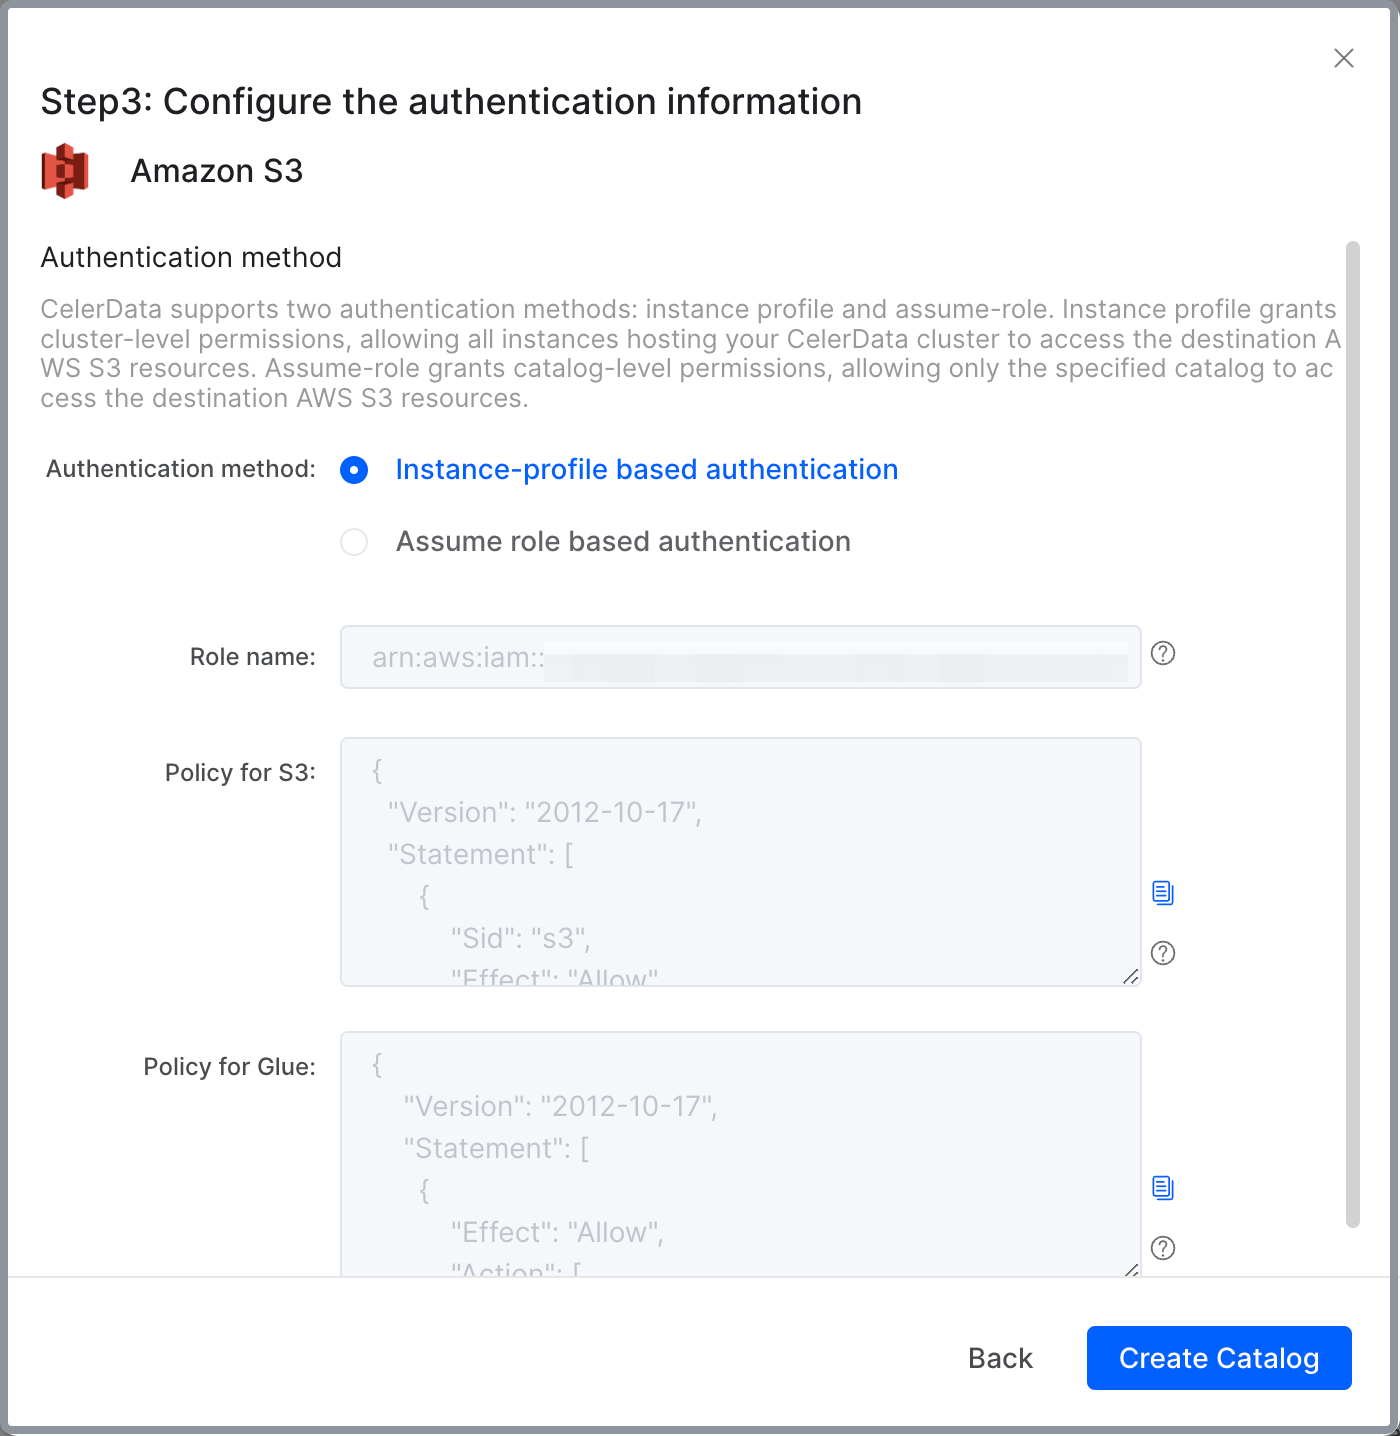
After configuring the authentication information, click Create Catalog.
View the data statistics of the internal catalog
- On the Data catalog tab, you can view the Type and Comment of the internal catalog.
- Click the catalog
default_catalogto view the information of the databases in the internal catalog, including their names, sizes, and remarks. - Click a specific database to view the information of the tables in the database, including their names, sizes, remarks, and creation times.
- Click a specific table to view the information of the partitions in the table, including their names, visible data versions, states, partition keys, partition ranges, bucket columns, bucket numbers, duplications, and sizes.
- Click a specific partition to view the information of the BE nodes that host tablets in the partition, including their IDs, tablet counts, row counts, data group counts, and sizes.
- Click a specific node to further view the information of the tablets in it, including their IDs, hosting nodes, valid data versions, row counts, data group counts, sizes, and states.
View the data statistics of external catalogs
- On the Data catalog tab, you can view the Type and Comment of external catalogs.
- Click a specific external catalog to view the databases in the external catalog.
- Click a specific database to view the tables in the database.
View query history and logs
CelerData supports viewing and searching for the records of all queries executed and being executed in a CelerData cluster. You can analyze and fine-tune the query performance based on the execution statistics and kill the running queries that are consuming excessive cluster resources.
The Query insights tab consists of three sub-tabs: History, Active queries, and Query logs.
The History sub-tab stores statistics of all executed queries in your CelerData cluster. It displays the Start time, Query ID, Status, SQL, Warehouse, Duration, Memory, Client IP, Query user, Query Time, Cpu Cost, Scanned Bytes, and Scanned Rows of the executed queries. Choose a specific Coordinator Node whose query history to view by selecting the IP address of the node. You can search for specific queries using corresponding filters. More filters can be enabled in the Filters drop-down list.
On this sub-tab, you can also terminate a running query:
- On the History sub-tab, search for the running query that you want to terminate.
- Click the KILL button next to the query's Query ID field.
- On the information that appears, click Confirm to terminate the query.
The Active queries sub-tab visualizes the statistics of queries that are running in the cluster. In this tab, you can view Top Queries by Resource Consumed (RAM Consumed, CPU Util, and Elapsed time), Query Details & Metrics of the top queries, number of running and queued queries, and Query Concurrency and Queues (MAX and AVG).
The Query Logs sub-tab retains the audit logs in your CelerData cluster. Each audit log records the Start time, Query ID, Cost, User, Client Address, and SQL of a query. You can choose a specific FE node to view the audit logs on it by selecting the IP address of the node. You can choose the start time and end time to search for specific audit logs.
Monitor your cluster and instances
The System monitoring tab provides you with real-time insights into the resource consumption and query performance of your CelerData cluster. With monitoring statistics, you can quickly identify and respond to performance issues before they become critical, and thus guarantee the smooth operation of the cluster.
The System monitoring tab consists of two sub-tabs: Cluster State and Instance State.
-
On the Cluster State sub-tab, you can view the charts of the following monitoring statistics:
- Cluster Data Size (MAX and AVG)
- Query QPS (MAX, MIN, and AVG)
- Ingested Times (SUM)
- Ingested Rows (SUM)
- Ingested Bytes (SUM)
The Cluster State metrics provide valuable insights into the overall performance of your CelerData cluster, allowing you to identify the operation trend and spot any performance bottlenecks that may require optimization.
You can choose a specific time range or choose the start time and end time to search for specific monitoring statistics.
-
On the Instance State sub-tab, you can view the charts of the following information:
- CPU Util (MAX, MIN, and AVG)
- Memory Util (MAX, MIN, and AVG)
- Memory Usage (MAX, MIN, and AVG)
- Disk Util (MAX, MIN, and AVG)
- Disk Usage (MAX, MIN, and AVG)
- Network Recv (MAX, MIN, and AVG)
- Network Send (MAX, MIN, and AVG)
- Disk Read IOPS (MAX, MIN, and AVG)
- Disk Write IOPS (MAX, MIN, and AVG)
- Disk Read (MAX, MIN, and AVG)
- Disk Write (MAX, MIN, and AVG)
With the Instance State metrics, you can identify the performance bottlenecks or issues that may be impacting specific instances, and thus take targeted action to resolve them.
You can choose the node of which statistics to display on the charts by selecting the IP address of the node in the Node section. You can also choose a specific time range or choose the start time and end time to search for specific monitoring statistics.
Load audit logs for SQL-based analysis
CelerData clusters keep track of all user activities in their audit logs, which allow cluster administrators to conduct post-incident investigations and troubleshoot any issues that may arise.
On the Administrator tab, you can enable the Audit Loader Plugin to load audit logs into the cluster. You can then perform SQL-based analysis on the cluster audit logs. For more information, see Manage audit logs within StarRocks via AuditLoader.