TPC-DS Benchmarking
TPC-DS is a decision support benchmark developed by the Transaction Processing Performance Council (TPC). It uses more comprehensive test datasets and complex SQL queries than TPC-H.
TPC-DS models several generally applicable aspects of a decision support system, including queries and data maintenance. TPC-DS aims to provide a comprehensive and realistic workload for testing and evaluating the performance of database systems in a retail environment. The TPC-DS benchmark simulates the sales and return data of three sales channels (stores, Internet, and catalog) in a retail enterprise. In addition to creating tables for sales and return data models, it also includes a simple inventory system and a promotion system.
This benchmark tests a total of 99 complex SQL queries against 24 tables whose data size ranges from 1 GB to 3 TB. The main performance metric is the response time of each query, which is the duration between the time a query is submitted to the time the result is returned.
Test Conclusions
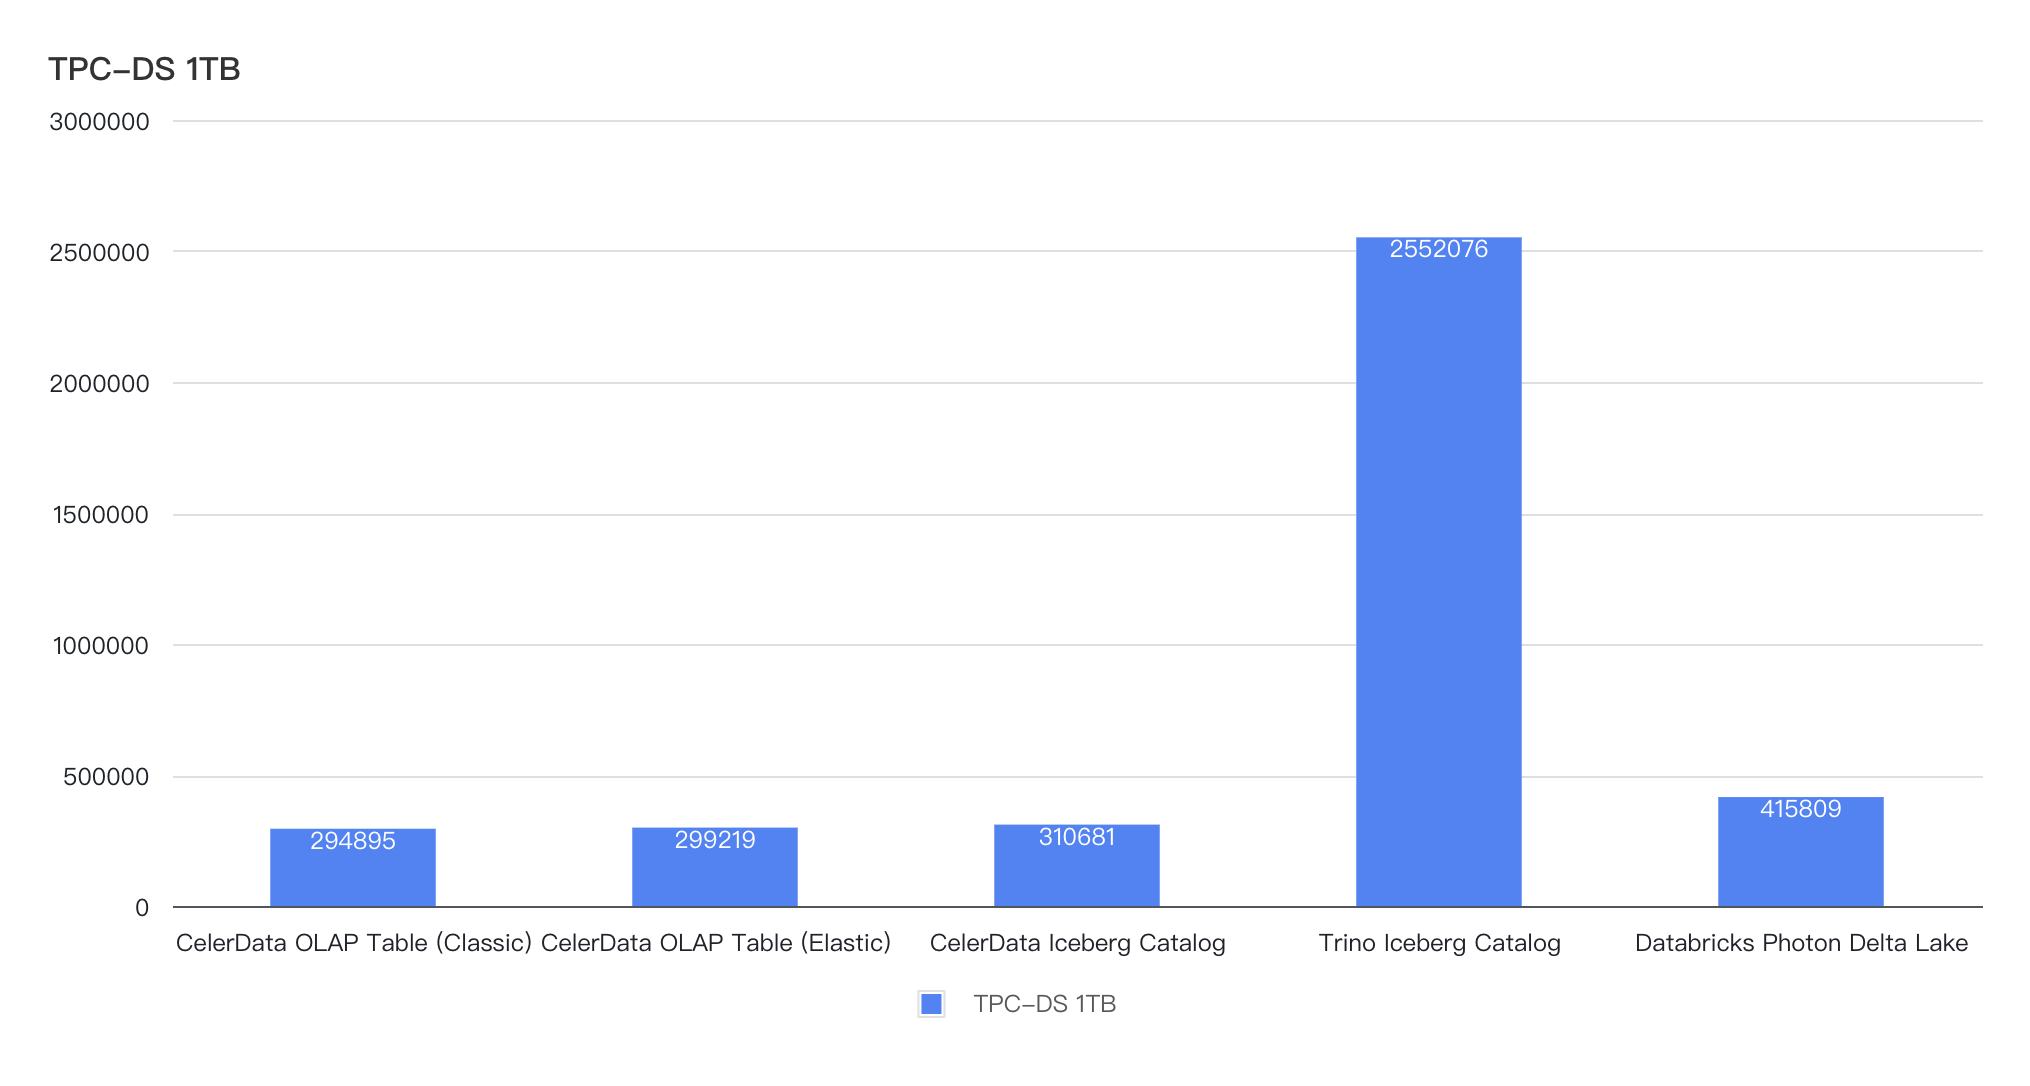
The test is performed against the TPC-DS 1 TB dataset on CelerData and Trino. The unit of the following results are milliseconds.
For CelerData, the test queries are performed on its native tables (under both classic and elastic architecture) and Iceberg Catalog (under elastic architecture). For Trino, the test queries are performed on the same Iceberg Catalog. Both tests for CelerData and Trino on the Iceberg Catalog use AWS Glue as the metastore, and Parquet-formatted data with ZSTD compression. For Databricks Photon, the test queries are performed on Delta Lake tables. It also uses AWS Glue as the metastore, and Parquet-formatted data with ZSTD compression.
The test results are:
- Queries performed on the OLAP table in the CelerData classic cluster took 295 seconds.
- Queries performed on the OLAP table in the CelerData elastic cluster took 299 seconds.
- Queries performed on Iceberg Catalog in the CelerData elastic cluster took 311 seconds.
- Queries performed on Iceberg Catalog in Trino took 2,552 seconds.
- Queries performed on Delta Lake in Databricks Photon took 415 seconds.
The conclusions are:
-
CelerData delivers comparable performance in both classic and elastic architecture
In OLAP table query scenarios, CelerData in the classic mode achieves 1.01× the performance of the elastic mode, indicating minimal performance overhead from storage-compute separation.
-
CelerData significantly outperforms Trino and Databricks Photon in Lakehouse query scenarios out of the box, with even greater advantages in OLAP table queries
- In Iceberg Catalog query scenarios, CelerData delivers 8.2× the performance of Trino and 1.3x the performance of Databricks Photon.
- In OLAP table queries, the performance gap widens further—CelerData achieves 8.52× (under classic mode) and 8.54× (under elastic mode) the performance of Trino, and 1.4x the performance of Databricks Photon (under both classic and elastic mode).
Test Preparation
Hardware
CelerData and Trino are deployed on hosts of the same configurations - AWS m6id.4xlarge.
| Spec | |
|---|---|
| Instance Number | 5 |
| vCPU | 16 |
| Memory (GiB) | 64 |
| Instance Storage (GB) | 1x950 NVMe SSD |
| Network Bandwidth (Gbps) | Up to 12.5 |
| EBS Bandwidth (Gbps) | Up to 10 |
Software
| CelerData | Trino | Databricks Photon | |
|---|---|---|---|
| Cluster Size | One FE, four BE | One Coordinator, four Workers | One Driver, four Workers |
| Version | 3.5.0 | 475 | 16.4 LTS |
| Release Date | 2025.6.13 | 2025.4.23 | 2025.5.9 |
| Configuration | set query_mem_limit=66571993088; (62 GB) | query.max-memory=224GBquery.max-memory-per-node=35GB | Default |
Test results
The following table shows the performance test results on 99 queries. The unit of query latency is milliseconds. All queries are warmed up 1 time and then executed 3 times to take the average value as the result. Trino vs CelerData on Iceberg and Databricks vs CelerData in the table header means using the query response time of Trino to divide the query response time of CelerData. A larger value indicates better performance of CelerData. Before the test on Iceberg Catalog, ANALYZE TABLE and EXPLAIN COST statements are executed on CelerData to collect statistics.
| Query | CelerData | Trino | Databricks Photon | Trino vs CelerData On Iceberg | Databricks vs CelerData | ||
|---|---|---|---|---|---|---|---|
| OLAP Table | Iceberg Catalog | Iceberg Catalog | Delta Lake | ||||
| Classic | Elastic | Elastic | |||||
| Lower number is better | CelerData advantage | ||||||
| SUM | 294,895 | 299,219 | 310,681 | 2,552,076 | 415,809 | 8.21 x | 1.34 x |
| Q01 | 748 | 605 | 709 | 2,276 | 1,891 | 3.21 x | 2.67 x |
| Q02 | 1,136 | 934 | 1,733 | 21,289 | 3,745 | 12.28 x | 2.16 x |
| Q03 | 193 | 146 | 404 | 1,764 | 1,002 | 4.37 x | 2.48 x |
| Q04 | 18,182 | 15,935 | 15,938 | 200,249 | 14,895 | 12.56 x | 0.93 x |
| Q05 | 465 | 541 | 1,748 | 5,574 | 1,714 | 3.19 x | 0.98 x |
| Q06 | 209 | 176 | 336 | 2,909 | 1,102 | 8.66 x | 3.28 x |
| Q07 | 666 | 941 | 1,597 | 3,638 | 2,072 | 2.28 x | 1.30 x |
| Q08 | 201 | 175 | 331 | 2,534 | 1,239 | 7.66 x | 3.74 x |
| Q09 | 4,549 | 3,970 | 5,518 | 36,125 | 6,720 | 6.55 x | 1.22 x |
| Q10 | 295 | 308 | 533 | 2,471 | 1,415 | 4.64 x | 2.65 x |
| Q11 | 10,888 | 9,669 | 9,916 | 133,230 | 11,302 | 13.44 x | 1.14 x |
| Q12 | 124 | 124 | 207 | 1,067 | 667 | 5.15 x | 3.22 x |
| Q13 | 418 | 444 | 1,805 | 18,297 | 2,567 | 10.14 x | 1.42 x |
| Q14 | 15,968 | 14,735 | 15,007 | 143,172 | 15,156 | 9.54 x | 1.01 x |
| Q15 | 533 | 456 | 555 | 2,158 | 992 | 3.89 x | 1.79 x |
| Q16 | 531 | 544 | 950 | 14,035 | 1,941 | 14.77 x | 2.04 x |
| Q17 | 1,012 | 942 | 1,638 | 5,487 | 2,895 | 3.35 x | 1.77 x |
| Q18 | 861 | 931 | 1,678 | 4,736 | 2,380 | 2.82 x | 1.42 x |
| Q19 | 234 | 264 | 502 | 1,870 | 2,341 | 3.73 x | 4.66 x |
| Q20 | 152 | 166 | 237 | 1,257 | 830 | 5.30 x | 3.50 x |
| Q21 | 86 | 80 | 199 | 945 | 618 | 4.75 x | 3.11 x |
| Q22 | 1,810 | 1,823 | 2,185 | 7,871 | 2,454 | 3.60 x | 1.12 x |
| Q23 | 83,120 | 79,428 | 51,596 | 488,653 | 34,193 | 9.47 x | 0.66 x |
| Q24 | 7,620 | 9,035 | 11,509 | 43,436 | 23,553 | 3.77 x | 2.05 x |
| Q25 | 844 | 919 | 1,389 | 4,347 | 2,479 | 3.13 x | 1.78 x |
| Q26 | 376 | 502 | 762 | 2,961 | 1,277 | 3.89 x | 1.68 x |
| Q27 | 458 | 533 | 1,333 | 4,219 | 1,925 | 3.17 x | 1.44 x |
| Q28 | 3,170 | 3,222 | 4,619 | 24,678 | 11,818 | 5.34 x | 2.56 x |
| Q29 | 1,324 | 2,096 | 2,149 | 10,640 | 7,165 | 4.95 x | 3.33 x |
| Q30 | 294 | 303 | 501 | 2,770 | 1,336 | 5.53 x | 2.67 x |
| Q31 | 2,193 | 2,030 | 2,407 | 10,260 | 3,560 | 4.26 x | 1.48 x |
| Q32 | 111 | 219 | 281 | 1,035 | 700 | 3.68 x | 2.49 x |
| Q33 | 237 | 241 | 613 | 2,743 | 1,279 | 4.47 x | 2.09 x |
| Q34 | 375 | 416 | 660 | 2,455 | 2,643 | 3.72 x | 4.00 x |
| Q35 | 1,392 | 1,405 | 1,600 | 8,023 | 2,300 | 5.01 x | 1.44 x |
| Q36 | 543 | 528 | 1,076 | 3,342 | 1,792 | 3.11 x | 1.67 x |
| Q37 | 253 | 242 | 208 | 6,178 | 967 | 29.70 x | 4.65 x |
| Q38 | 4,706 | 4,546 | 5,214 | 38,408 | 4,978 | 7.37 x | 0.95 x |
| Q39 | 361 | 348 | 813 | 5,696 | 3,681 | 7.01 x | 4.53 x |
| Q40 | 122 | 131 | 515 | 1,554 | 1,263 | 3.02 x | 2.45 x |
| Q41 | 47 | 47 | 75 | 271 | 427 | 3.61 x | 5.69 x |
| Q42 | 81 | 101 | 194 | 996 | 545 | 5.13 x | 2.81 x |
| Q43 | 488 | 674 | 653 | 4,108 | 1,624 | 6.29 x | 2.49 x |
| Q44 | 1,450 | 1,574 | 5,003 | 16,468 | 3,770 | 3.29 x | 0.75 x |
| Q45 | 418 | 409 | 529 | 2,212 | 908 | 4.18 x | 1.72 x |
| Q46 | 1,462 | 1,704 | 1,502 | 4,780 | 2,594 | 3.18 x | 1.73 x |
| Q47 | 2,797 | 2,759 | 3,242 | 42,704 | 5,435 | 13.17 x | 1.68 x |
| Q48 | 491 | 523 | 1,335 | 12,464 | 1,806 | 9.34 x | 1.35 x |
| Q49 | 496 | 514 | 1,344 | 3,827 | 1,927 | 2.85 x | 1.43 x |
| Q50 | 3,738 | 4,968 | 4,187 | 21,771 | 4,862 | 5.20 x | 1.16 x |
| Q51 | 4,725 | 4,574 | 3,418 | 12,247 | 4,603 | 3.58 x | 1.35 x |
| Q52 | 91 | 106 | 224 | 1,007 | 592 | 4.50 x | 2.64 x |
| Q53 | 457 | 628 | 894 | 1,768 | 1,201 | 1.98 x | 1.34 x |
| Q54 | 208 | 257 | 777 | 31,864 | 2,205 | 41.01 x | 2.84 x |
| Q55 | 87 | 105 | 219 | 1,187 | 580 | 5.42 x | 2.65 x |
| Q56 | 175 | 185 | 500 | 2,133 | 1,272 | 4.27 x | 2.54 x |
| Q57 | 1,759 | 1,728 | 2,132 | 26,042 | 3,963 | 12.21 x | 1.86 x |
| Q58 | 239 | 251 | 522 | 3,032 | 1,050 | 5.81 x | 2.01 x |
| Q59 | 3,745 | 3,736 | 3,361 | 20,819 | 3,289 | 6.19 x | 0.98 x |
| Q60 | 254 | 295 | 649 | 2,749 | 1,432 | 4.24 x | 2.21 x |
| Q61 | 332 | 338 | 936 | 2,054 | 1,926 | 2.19 x | 2.06 x |
| Q62 | 509 | 528 | 902 | 5,104 | 1,250 | 5.66 x | 1.39 x |
| Q63 | 447 | 629 | 866 | 1,719 | 1,162 | 1.98 x | 1.34 x |
| Q64 | 4,445 | 8,719 | 8,291 | 16,990 | 11,967 | 2.05 x | 1.44 x |
| Q65 | 2,836 | 2,771 | 3,639 | 20,616 | 6,894 | 5.67 x | 1.89 x |
| Q66 | 398 | 388 | 1,094 | 3,511 | 2,005 | 3.21 x | 1.83 x |
| Q67 | 29,203 | 28,392 | 21,684 | 89,430 | 38,399 | 4.12 x | 1.77 x |
| Q68 | 255 | 331 | 708 | 2,883 | 2,018 | 4.07 x | 2.85 x |
| Q69 | 276 | 281 | 468 | 2,181 | 1,190 | 4.66 x | 2.54 x |
| Q70 | 2,815 | 2,917 | 3,454 | 21,499 | 4,195 | 6.22 x | 1.21 x |
| Q71 | 278 | 1,110 | 639 | 2,578 | 8,562 | 4.03 x | 13.40 x |
| Q72 | 1,636 | 1,874 | 5,077 | 504,573 | 5,265 | 99.38 x | 1.04 x |
| Q73 | 195 | 230 | 377 | 1,933 | 942 | 5.13 x | 2.50 x |
| Q74 | 9,086 | 8,986 | 9,082 | 78,071 | 7,853 | 8.60 x | 0.86 x |
| Q75 | 6,258 | 7,410 | 8,992 | 26,270 | 10,089 | 2.92 x | 1.12 x |
| Q76 | 2,466 | 2,329 | 4,824 | 11,266 | 4,550 | 2.34 x | 0.94 x |
| Q77 | 240 | 237 | 696 | 2,785 | 1,167 | 4.00 x | 1.68 x |
| Q78 | 16,750 | 15,860 | 19,231 | 51,497 | 16,739 | 2.68 x | 0.87 x |
| Q79 | 2,142 | 2,358 | 1,680 | 5,572 | 2,005 | 3.32 x | 1.19 x |
| Q80 | 561 | 850 | 2,534 | 4,762 | 2,774 | 1.88 x | 1.09 x |
| Q81 | 493 | 500 | 763 | 4,040 | 2,042 | 5.29 x | 2.68 x |
| Q82 | 611 | 605 | 839 | 11,622 | 1,262 | 13.85 x | 1.50 x |
| Q83 | 160 | 212 | 400 | 2,274 | 1,388 | 5.69 x | 3.47 x |
| Q84 | 213 | 443 | 320 | 3,086 | 898 | 9.64 x | 2.81 x |
| Q85 | 473 | 685 | 1,241 | 5,424 | 1,790 | 4.37 x | 1.44 x |
| Q86 | 733 | 738 | 856 | 3,422 | 1,072 | 4.00 x | 1.25 x |
| Q87 | 4,651 | 4,889 | 5,143 | 41,300 | 5,842 | 8.03 x | 1.14 x |
| Q88 | 1,565 | 1,586 | 2,821 | 30,738 | 13,892 | 10.90 x | 4.92 x |
| Q89 | 534 | 738 | 916 | 2,227 | 1,420 | 2.43 x | 1.55 x |
| Q90 | 326 | 336 | 634 | 3,890 | 1,442 | 6.14 x | 2.27 x |
| Q91 | 102 | 98 | 232 | 2,035 | 814 | 8.77 x | 3.51 x |
| Q92 | 85 | 143 | 250 | 994 | 653 | 3.98 x | 2.61 x |
| Q93 | 3,790 | 4,603 | 5,776 | 22,926 | 3,755 | 3.97 x | 0.65 x |
| Q94 | 599 | 984 | 995 | 5,884 | 1,582 | 5.91 x | 1.59 x |
| Q95 | 1,759 | 3,003 | 2,666 | 29,607 | 2,053 | 11.11 x | 0.77 x |
| Q96 | 1,510 | 1,409 | 2,561 | 4,905 | 2,103 | 1.92 x | 0.82 x |
| Q97 | 4,745 | 5,013 | 5,517 | 22,726 | 5,867 | 4.12 x | 1.06 x |
| Q98 | 285 | 313 | 350 | 1,911 | 3,690 | 5.46 x | 10.54 x |
| Q99 | 1,165 | 1,192 | 1,496 | 10,970 | 2,360 | 7.33 x | 1.58 x |